Why Electricity Is the First Cost Distributors Underestimate
A quote to a print farm usually starts with machine price, then filament, then labour. Electricity sits at the bottom of the sheet because it appears on a different utility bill than the supplier ever sees. In practice it is the cost item that varies most per part, because it scales with machine count, chamber temperature and how well the farm schedules its jobs, and none of those three are visible in a purchase order.
The reason it matters for distributors is different from the reason it matters for the end customer. A distributor who can show a customer the realistic running cost across a fleet of thirty machines, using the customer's own tariff and shift pattern, wins the account from a competitor quoting machine price alone. The cost model below is the one to build, with numbers that are close enough to argue about and precise enough to be defensible.
The Four Components of a Print Farm Electricity Bill
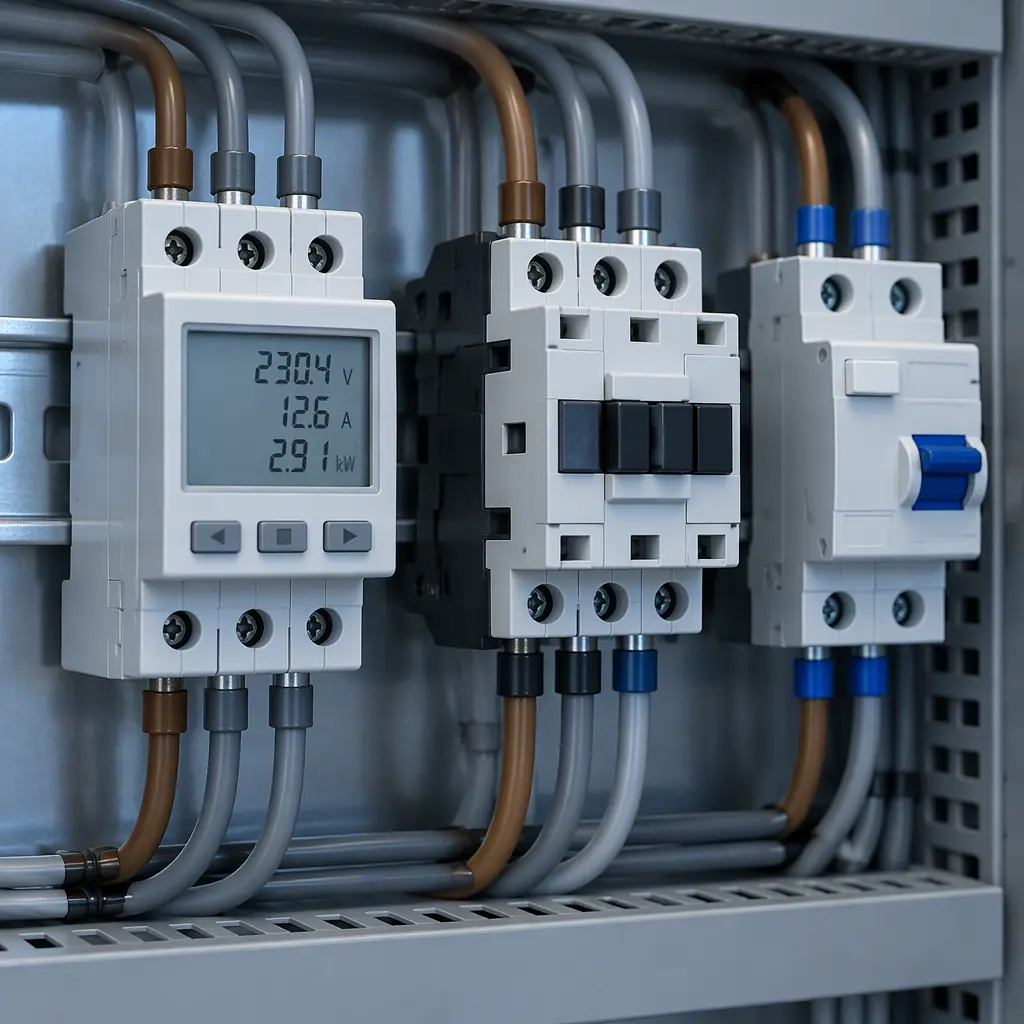
Machine energy is only one of four loads, and on a farm with heated chambers and drying equipment it is not always the largest. Before quoting a running cost, separate the bill into these four lines:
A farm running unheated open-frame printers for PLA work sees a different split from one running engineering materials in sealed chambers, and quoting the first machine's numbers to the second customer is how a distributor loses credibility in the first meeting. The distribution of load matters more than the total, because it tells you which line has a lever available.
Measuring kWh per Part Without a Dedicated Meter
Most distributors do not have a clamp meter on site, and most customers will not buy one to answer a question they did not ask. There are three workable measurement levels, and all three are better than an estimate from a spec sheet.
Level 1: Whole-panel meter reading
Read the distribution board meter at the start and end of a known production shift, with the rest of the building shut down or its baseline recorded separately. This gives kWh per shift for the entire print cell, including conditioning and extraction. Divide by parts produced in the shift. The figure is coarse but honest, and it takes fifteen minutes and no equipment.
Level 2: Plug-in energy logger per machine
A plug-in logger on a single representative machine gives a clean per-job profile, including the heating spike that dominates short jobs. Log three jobs: a two-hour small part, an eight-hour medium part and a twenty-four-hour large part. The three numbers together characterise the machine far better than a single average, because marginal energy per part is very different at each job length.
Level 3: Smart plugs across the fleet
At twenty machines and above, smart plugs with local data logging cost little and give per-machine, per-job data continuously. This is also the data source that makes an energy discussion with the customer's finance team possible, because it separates idle consumption from production consumption. Idle draw on a heated chamber left running overnight is often the single largest avoidable line on the bill:
Those idle numbers are why scheduling discipline is an energy measure. A machine that finishes at 22:00 and sits hot until the morning shift is consuming nearly a full shift of printing energy while producing nothing. Queue management, covered in our print farm scheduling guide, is usually a larger saving than any machine-level efficiency change.
Converting kWh into a Cost per Part
The arithmetic is simple once the measurement exists, and the mistake to avoid is using an industrial average tariff when the customer is on a commercial tariff with a demand charge.
Take a medium engineering part: eight hours of printing at 350 W average, plus one hour of heating and stabilisation at 1,200 W. That is 2.8 kWh for printing and 1.2 kWh for heat-up, so 4.0 kWh per part. At a commercial rate of €0.22 per kWh the energy cost is €0.88 per part. Forty parts per machine per week across a twenty-machine farm reaches 3,200 kWh per month, roughly €700, which is the number the customer will remember from the meeting.
Per-part electricity of €0.50 to €3.00 across most FDM work is a normal range, and it is small against material cost for a part weighing 100 g in a €25/kg polymer. That does not make it irrelevant: it is the cost that stays when material is supplied by the customer and machines are already paid for, and it is the one that becomes visible when a farm's margin is squeezed.
Tariff Structure: Where the Real Variation Sits
Two customers with identical machines and identical parts can differ by 40 percent on energy cost per part purely through tariff and scheduling. The variables worth asking about in a site assessment are these:
- Flat versus time-of-use. A farm able to shift long jobs into an off-peak window can cut the rate on the majority of its consumption. This is a scheduling question, not a machine question.
- Demand charge basis. Whether the peak is measured over 15 or 30 minutes changes whether staggering heat-up is worthwhile.
- Power factor penalties. Uncorrected switch-mode supplies on many machines at once can attract a reactive power charge on larger sites.
- Solar self-consumption. A farm with roof generation should schedule printing into daylight hours, which reverses the off-peak logic entirely.
Machine selection interacts with all four. A machine with a faster heat-up and a well-insulated chamber reduces the size of the spike, which helps on demand-charge tariffs; a machine with a low idle draw helps on flat tariffs where total consumption is what matters. Neither is visible in a datasheet's headline power figure, and the ceiling on machine-level efficiency is set upstream by hotend and chamber hardware, as covered in our hotend melt capacity guide. Power quality, inrush and neutral loading are covered separately in our power quality guide.
Estimating Energy Across a Whole Fleet
For a fleet, build the estimate from machine states rather than from a per-part average. The structure that survives scrutiny is a small table per machine class, filled from meter data, and multiplied by the actual operating pattern of the farm.
Applied to thirty machines at 70 percent utilisation, a mixed engineering and PLA workload typically lands between 6,000 and 12,000 kWh per month. Quoting a single kWh figure for a whole farm, without stating utilisation and material mix, is the reason energy estimates in proposals are usually ignored by the customer's technical team.
What Reduces the Bill, in Order of Payback
Ranked by what actually moves the number, based on the measurement above rather than on equipment catalogues:
- Queue discipline and shutdown policy. No machine idles hot without a scheduled next job. Fastest payback, zero capital.
- Insulated chamber panels. Reduces steady-state chamber power by roughly a third on sealed machines heated above 50 °C. Low cost, immediate.
- Batch heat-up staggering. Removes or reduces demand charges. Free with software.
- Material conditioning moved to the job window. Dryers running continuously for a two-shift week cost more than dryers run ahead of each production run.
- Machine replacement. Last, not first. A newer machine may save 20 to 30 percent of printing energy while a paid-off machine still has capital value; the case rests on reliability and throughput, not electricity.
That order is worth carrying into a customer conversation, because it reframes a purely technical topic as operating discipline, which is where the customer's own team has authority. The broader cost model per part is set out in our energy and operating cost guide, and where material conditioning and chamber temperature dominate the bill, the drying side is covered in our heated chamber and active drying guide, and the total cost view including labour and floor space in our TCO and ROI guide.
Offering an Energy Assessment as a Distributor Service
An energy assessment is a low-cost service that positions a distributor as an operations partner rather than a box mover, and it produces the data needed to justify a fleet configuration change. A workable package is a half-day visit, a plug-in logger across two representative machines for a week, a panel meter reading at shift start and end, and a one-page output showing kWh per part, idle waste, and the three highest-value changes.
The commercial return is that the assessment ends in a concrete recommendation the customer can act on, whether that is a scheduling policy, an enclosure upgrade or a machine replacement. Distributors using this format typically find that one in three assessments converts into an order within two quarters, and that the credibility from having measured rather than estimated shortens the next negotiation considerably.
Precise3D on Measured, Documented Consumption
Our platforms are supplied with per-state power figures measured on production units rather than copied from component datasheets: standby, idle, printing PLA, printing engineering polymer with chamber heat, and chamber heat-up. The chamber insulation and heater control are specified so that steady-state chamber power stays within a documented band, which is the figure that dominates a farm running engineering materials. Machines ship with CE LVD (EN 62368-1:2014+A11:2017) and RoHS (EU 2015/863) documentation from a 3,500 sqm Shenzhen production network with a documented control plan at incoming and outgoing QC.
For distributors, the value is that the energy model in your proposal can be built from documented figures your customer can audit, rather than from an estimate they have to trust. Configuration options, measurement sheets and MOQ terms are available on request with MOQ from 100 units.
Reviewed by the Precise3D engineering team. Power figures and cost examples are industry-typical ranges for orientation and are not a specification for any particular machine, material or tariff. Measure on site before committing to a configuration or quoting a running cost.
Quoting a Fleet Running Cost?
Ask for Measured Power Figures per Machine State
Tell us your material mix, chamber temperatures and shift pattern. We will send per-state power measurement sheets and the chamber heat figures needed to build an energy model your customer can audit.