Ask any 3D printer distributor what matters most to a B2B buyer, and you will hear the same answers: print quality, reliability, material compatibility, price. Almost nobody mentions electricity. And that is exactly why energy consumption is the most underused closing tool in B2B 3D printer sales. Because your competitors are not talking about it either.
A printer that draws 200 watts instead of 120 watts sounds like a trivial difference. But for a print farm running 50 machines 24 hours a day, that 80-watt gap costs an additional $421 per month at average US electricity rates, or $5,052 per year. Over a three-year printer lifecycle, the "cheaper" machine has silently consumed $15,156 more in electricity than its energy-efficient competitor, completely erasing any upfront price advantage. This is the energy efficiency math that most distributors never present to their buyers. And it is why the ones who do win larger deals at higher margins.
Why Energy Costs Are the Hidden Line in Every TCO Spreadsheet
Most distributors who build a total cost of ownership analysis for their buyers include four lines: hardware acquisition, consumables, maintenance, and labor. Energy is either omitted entirely or estimated with a single back-of-the-envelope number that is never revisited. This is a mistake. And it is a mistake your buyers are starting to notice.
In 2026, corporate procurement departments are under increasing pressure to account for operational energy costs in capital equipment decisions. ESG reporting requirements, rising industrial electricity rates in Europe (Germany hit an average of €0.38/kWh for industrial users in early 2026), and the simple math of running equipment 24/7 have all converged to make energy efficiency a boardroom-level purchasing criterion. The distributor who shows up with a detailed energy cost projection is not just providing a number. They are demonstrating that they understand the buyer's total operational picture.
Consider this: for a mid-sized engineering department running 8 printers 16 hours a day, energy is typically 3-5% of total TCO, small enough to ignore. But for a print farm with 50 machines running around the clock, energy jumps to 12-18% of three-year TCO, making it the third-largest cost line after consumables and hardware. Ignoring it is not prudent, it is leaving a six-figure cost unexamined. Our print farm economics guide provides the complete operational cost model that incorporates these energy figures.
Power Draw by Printer Tier: Real-World Measurements
Published wattage figures on spec sheets are often misleading. A printer labeled "350W" may draw 350W only during initial bed heating; during steady-state printing it may settle at 180-220W. Conversely, a printer with a 150W-rated PSU may spike to 200W during simultaneous bed and hotend heating. The numbers that matter for cost calculation are average power draw over a complete print cycle, not the peak rating listed on the power supply.
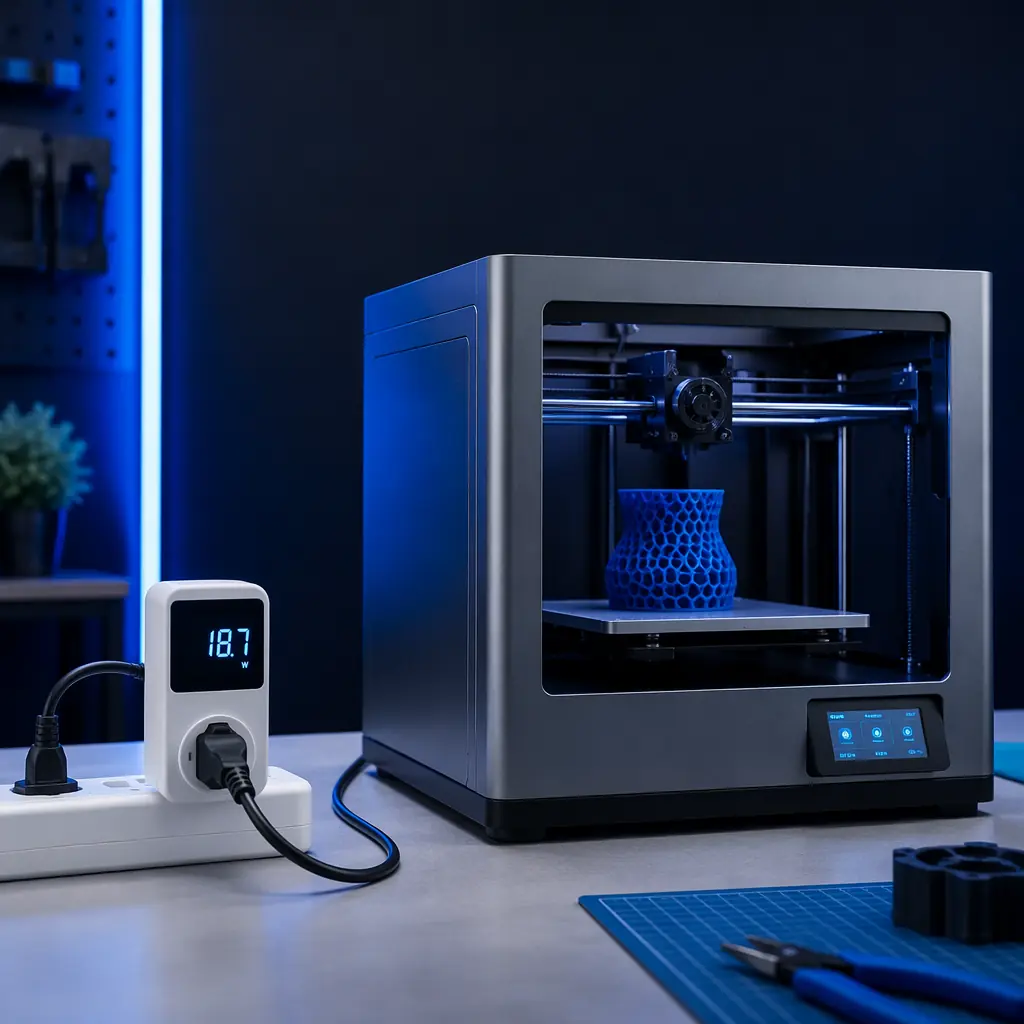
Below are real-world measurements collected from Precise3D distributor field data across the three most common printer tiers in B2B deployments. All measurements represent average draw during PLA printing at 200°C nozzle / 60°C bed, measured at the wall with a plug-in power meter over a minimum 4-hour print cycle.
The jump from prosumer to industrial is where energy consumption becomes a genuine line-item concern. A large-format printer with a 60°C actively heated chamber, 400×400mm AC bed heater, and dual hotends can draw 900 watts continuously during a 20-hour ABS print . Consuming 18 kWh per print. At Germany's industrial electricity rate of €0.38/kWh, that single print costs €6.84 in electricity alone, before a single gram of filament is accounted for.
This is also where heated chamber technology becomes a critical cost factor. A well-insulated heated chamber that reaches target temperature in 15 minutes and holds it with a 200W maintenance draw is fundamentally different from a poorly insulated chamber that takes 40 minutes to heat and pulls 500W continuously. The insulation quality alone can create a €400/year electricity cost difference on a single machine running daily ABS prints. See our enclosure and ventilation bundling guide for the full thermal management picture.
Cost Per Print Hour: The Only Number Your Buyer Actually Needs
The calculation is straightforward: (average watts × print hours × kWh rate) ÷ 1,000 = electricity cost per print. But the kWh rate, the denominator that turns watts into dollars, varies so dramatically by region that the same printer can cost 5× more to operate in one country versus another. Below is a global comparison using actual industrial and residential electricity rates as of mid-2026.
A single 200W prosumer printer costs $17/month to run 24/7 in the US. In Germany, that same printer costs $55/month. For a 50-machine print farm, the annual electricity bill ranges from $6,912 in China to $32,832 in Germany . A $25,920 spread driven entirely by regional electricity rates. If you are selling into the German market and not presenting an energy cost comparison, you are ignoring the single largest operational cost differentiator available to you.
What you're looking for: Buyers operating from residential or small-commercial premises often pay residential rates (30-60% higher than industrial). A 50-machine print farm on a residential tariff can be paying $6,000/year more than necessary, and the energy cost comparison you present may be the trigger that prompts them to negotiate a better rate with their utility. Either way, the number you plug into your TCO model must be their actual tariff, not a national average.
Print Farm Energy Economics: When Watts Become a Line Item
At the print farm scale, energy efficiency stops being a sustainability talking point and becomes a direct profit margin driver. Consider a 50-machine farm running 24/7 with an average continuous draw of 200W per machine at $0.12/kWh:
A high-efficiency fleet saves your buyer $4,147 per year . Or $12,442 over a three-year printer lifecycle . In electricity alone. At Germany's €0.38/kWh rate, those savings triple to €13,133 per year. Now consider that a high-efficiency printer might carry a $150-200 premium over a standard-efficiency competitor. The payback period: under 18 months at US rates, under 5 months in Germany. After that, every kilowatt-hour saved is pure margin flowing to the buyer's bottom line.
This is the conversation that closes print farm deals. Not "our printer is more energy efficient". But "our printer saves you $12,442 over three years, which means the $200 per-unit premium pays back in 15 months, and every print after that costs 40% less in electricity than the competitor's machine." The precision of the number is what builds credibility. See our PSU selection guide for the component-level data on why some power supplies deliver this efficiency and others do not.
Energy Efficiency Features That Actually Move the Needle
Not all "energy-saving" features are created equal. Some are genuine cost reducers; others are marketing bullet points that save single-digit watts. Here is what actually matters, ranked by real-world impact on a print farm's electricity bill.
1. PSU efficiency rating (80 Plus certification). This is the single largest lever. A generic PSU operates at 75-82% efficiency. Meaning 18-25% of the electricity it pulls from the wall is lost as heat before it ever reaches the printer's components. An 80 Plus Gold PSU operates at 87-90% efficiency. For a printer drawing 200W at the components, the generic PSU pulls 250W from the wall (50W wasted). The Gold PSU pulls 225W, saving 25W continuously. Over 8,760 hours of annual operation, that is 219 kWh saved per machine, or $26.28/year at US rates. Across 50 machines: $1,314/year. The cost difference between a generic and Gold-rated PSU at OEM volumes: approximately $8-12. That is a 4-month payback on a component that costs a few dollars more.
2. Heated chamber insulation quality. An actively heated chamber is the single largest energy consumer in industrial-tier printing. A well-insulated chamber with double-wall construction and proper door sealing might draw 200W to maintain 60°C once at temperature. A poorly insulated chamber with single-wall acrylic panels can draw 400-500W for the same temperature, and cycle the heater more frequently, creating temperature fluctuations that also degrade print quality. Over a 20-hour ABS print, that is a 4-6 kWh difference, roughly $0.50-2.30 depending on local rates. For a machine printing engineering materials daily, the annual difference exceeds $180-840 per machine. Our thermal runaway protection guide covers the safety implications of high-wattage chamber heating as well.
3. Intelligent idle and sleep modes. A printer that sits idle at 20W for 16 hours between prints wastes 320 Wh per day. A machine with automatic sleep that drops to 3W idles at 48 Wh. The difference, 272 Wh/day, is modest at $0.03/day. But a 50-machine farm wastes $547/year on idle power alone if the machines lack sleep modes. Features like automatic bed shutdown after print completion, hotend cooldown timers, and scheduled power-off during known idle windows (night shifts, weekends) compound into meaningful savings at scale.
4. DC bed heaters with PWM control vs AC with bang-bang thermostats. AC bed heaters are simpler and cheaper but less precise, they cycle between full power and off, often overshooting the target temperature and wasting energy in the process. DC bed heaters with PWM (pulse-width modulation) control maintain temperature within ±0.5°C using only the power needed to offset thermal loss, reducing bed heater energy consumption by 15-25% on long prints.
How to Sell Energy Efficiency to B2B Buyers
The mistake most distributors make is presenting energy efficiency as a secondary feature, something to mention after print quality, speed, and material compatibility. The winning approach is to lead with the dollar number and let the features explain why the number is what it is.
Open with the cost comparison.
"Your electricity rate is $0.28/kWh. Our printer draws 120W average during PLA printing. The competitor's equivalent draws 200W. Over three years of 16-hour daily operation, that is a $420 difference per machine, before we even discuss filament or maintenance." This framing does three things: it demonstrates you have done homework on their actual operating costs, it positions your machine as objectively cheaper regardless of sticker price, and it sets the terms of comparison in dollars, where you win, rather than specs, where the difference may be narrower.
Connect energy efficiency to procurement policy.
Increasingly, corporate and institutional buyers, universities, government agencies, large manufacturers, have formal energy efficiency requirements in their RFPs. A printer that carries an 80 Plus Gold PSU and consumes under 150W average can satisfy green procurement criteria that disqualify competitors outright. If your buyer's procurement department has an ESG or sustainability mandate, energy consumption data is not a nice-to-have, it is a gatekeeping requirement that determines which machines even make the shortlist.
Build the three-year projection.
Do not just state the per-hour cost. Build a simple table showing year 1, year 2, and year 3 electricity costs for your machine versus the competitor, at the buyer's actual local kWh rate. Sum the total. Then subtract your machine's unit price premium (if any). If the resulting number is positive, and with a meaningful wattage delta, it almost always is, you have just proven that the "more expensive" printer is actually cheaper. That is a conversation-ender in the best possible way.
One Precise3D distributor in the Netherlands used exactly this approach to close a 40-machine university lab deal in late 2025. The competing bid was €65/unit cheaper on hardware. The distributor built a three-year energy projection using the university's actual €0.32/kWh campus rate, showing that Precise3D's 80 Plus Gold PSU and efficient bed heating would save €4,320 across the fleet over three years, more than erasing the €2,600 hardware premium. The university's procurement committee, which had a formal sustainability scoring criterion in its RFP, awarded the full contract to Precise3D. The energy analysis was the tiebreaker that converted a price disadvantage into a total-cost victory.
Reviewed by the Precise3D engineering & OEM team. Compliance files that accompany the catalog are auditable at the certification register.
Partner With Precise3D
Get the Energy Cost Data That Wins B2B Deals
Every Precise3D distributor receives per-model power consumption data measured at the wall, regional electricity cost comparison tools, and a pre-built energy TCO spreadsheet. Stop selling on wattage. Start selling on the dollar savings your buyers can take to their CFO.