The Four Costs That Follow a Failed Build
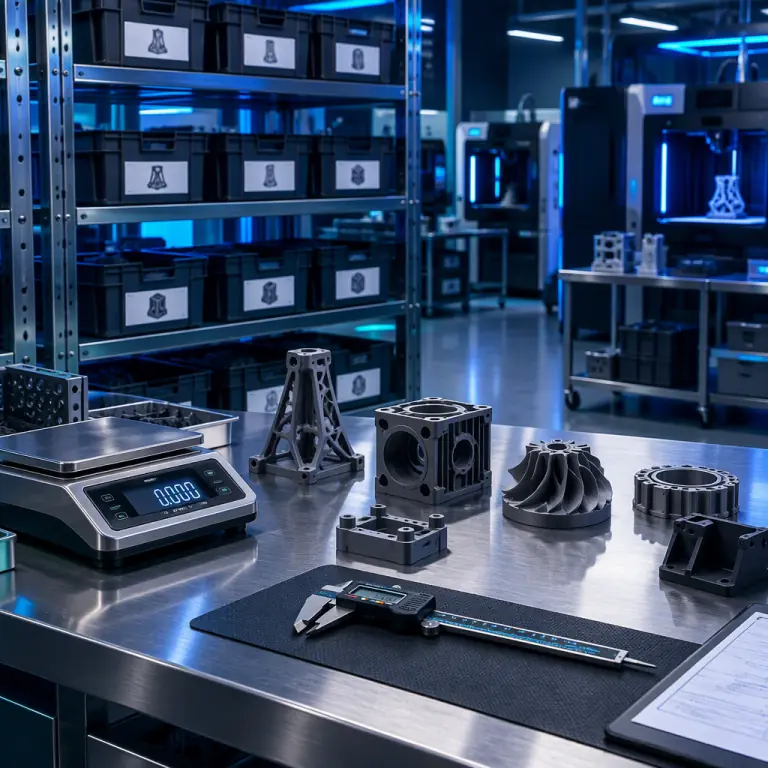
Additive manufacturing has an unusually clean failure signal: the part either came off the plate or it did not. That clarity is deceptive, because the visible event is the least expensive part of the loss. The build material is often a small fraction of the total cost of a failure, particularly for engineering polymers where machine time and labour dominate.
The accounting failure is structural rather than careless. Machine time, labour and expedited freight are all real costs, but they land in different accounts from material scrap, so no single report ever shows the total. The only practical remedy is to build the roll-up deliberately: define a standard cost per machine hour, a standard rate for technical labour, and a rule that any expedited shipment caused by a quality escape is coded to quality, not to logistics.
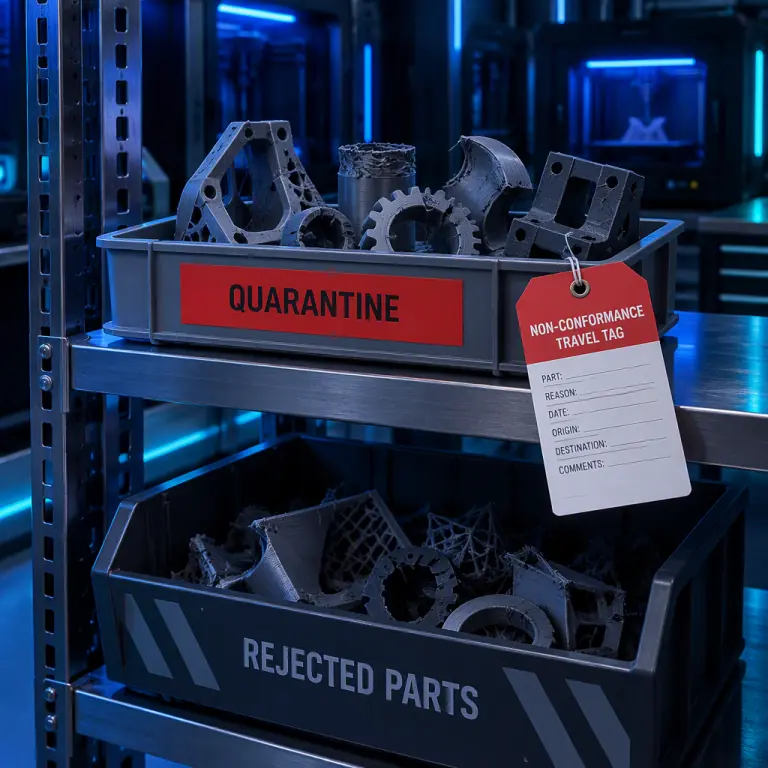
The distinction between internal and external failure cost is the one that changes behaviour. Internal failure — caught before shipment — costs money. External failure — caught by the customer — costs money multiplied by a factor that depends entirely on how forgiving the customer is. A distributor or bureau whose external failure cost has never been calculated is pricing risk it has not measured.
Building the Cost of Poor Quality Number
Cost of poor quality is calculated, not measured, because much of it consists of standard rates applied to countable events. The reliability of the number depends on whether the events are counted honestly, not on whether the rates are exact. A rough rate applied to a complete event log is far more useful than a precise rate applied to an incomplete one.
Two structural observations follow from this table. First, appraisal and prevention costs are quality costs too, and they belong in the same report as failure costs, because otherwise the report implies that all quality spending is waste. Second, the ratio between the four categories is the diagnostic. An operation whose spend is dominated by external failure is buying its quality at the most expensive possible point in the process; the same money spent on prevention would buy more.
What you're looking for: An answer that only cites scrap material means the number is not being calculated, and the operation is probably making pricing decisions on a fraction of its real cost base. An answer that breaks out internal failure, external failure, appraisal and prevention means the operation can see where it is buying quality, and can redirect spend from failure to prevention with a measurable payback.
The 8D Structure and Why Steps Get Skipped
The 8D method is a disciplined sequence for resolving a quality escape permanently rather than repeatedly. Its value is less in its novelty than in its enforcement of order: each step is a gate, and the steps most commonly skipped are precisely the ones that prevent recurrence.
The step that carries the most weight is D4, because a single root cause is usually insufficient. Three distinct causes have to be identified. The occurrence cause is why the defect was created. The escape cause is why it was not detected before it left. The systemic cause is why the management system allowed a defect to be created and escape. An operation that fixes only the occurrence cause will create the same class of defect again through a different mechanism, because the detection and system layers were never strengthened.
The step that most often gets abandoned is D7, and it is the step that determines whether the exercise had value. D7 asks what else in the operation has the same weakness. If a failure mode was missed at final inspection, D7 asks which other characteristics share that inspection method. This is the loop-closing discipline that an FMEA and control plan is built to institutionalise, and without it an 8D resolves one complaint and leaves the category open.
Root Cause Analysis That Survives Contact with Reality
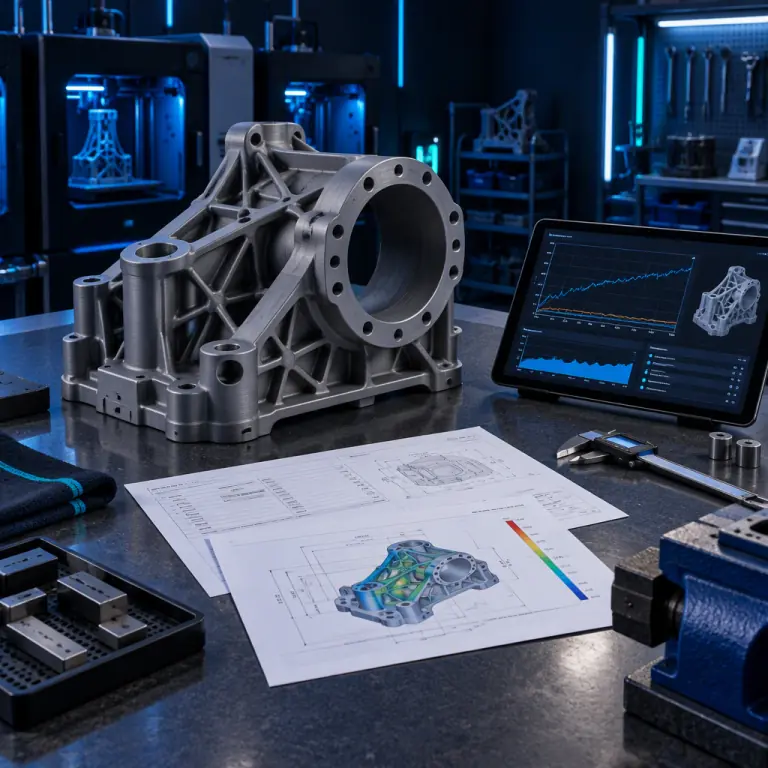
Root cause tools fail in print operations for a specific reason: the process is instrumented, so the data exists, but it is not consulted. A build log can show that the chamber temperature never reached setpoint before the first layer went down. That is a fact, and it should terminate the discussion. Far more often, the discussion continues on the basis of what the operator remembers.
- Reconstruct the build from the log before forming a hypothesis. Chamber temperature, flow rate and any fault flags are recorded data. Start from them, and treat recollection as a last resort.
- Test the cause, do not vote on it. A root cause that has not been demonstrated by turning it on and off is a hypothesis. The demonstration is usually cheap: rerun the failed geometry with the suspected factor restored to the correct value.
- Look for the escape, not just the defect. A defect that reached the customer passed through every inspection step in the operation. Each pass-through is a separate finding.
- Separate common cause from special cause. A defect that appears at a stable low rate across all work is a system problem, and reacting to individual occurrences of it makes the process worse. This is a statistical conclusion, not an intuitive one.
The statistical distinction is why an unstable process cannot be improved by exhortation. A process whose run-to-run variation has not been characterised will produce complaints that look random, and each will be treated as a special cause requiring a heroic response. The measurement discipline that makes the distinction possible is the same one covered in our reliability and uptime guide, and the parameter characterisation behind it is covered in our design of experiments guide.
Deciding Where to Spend the Next Hour
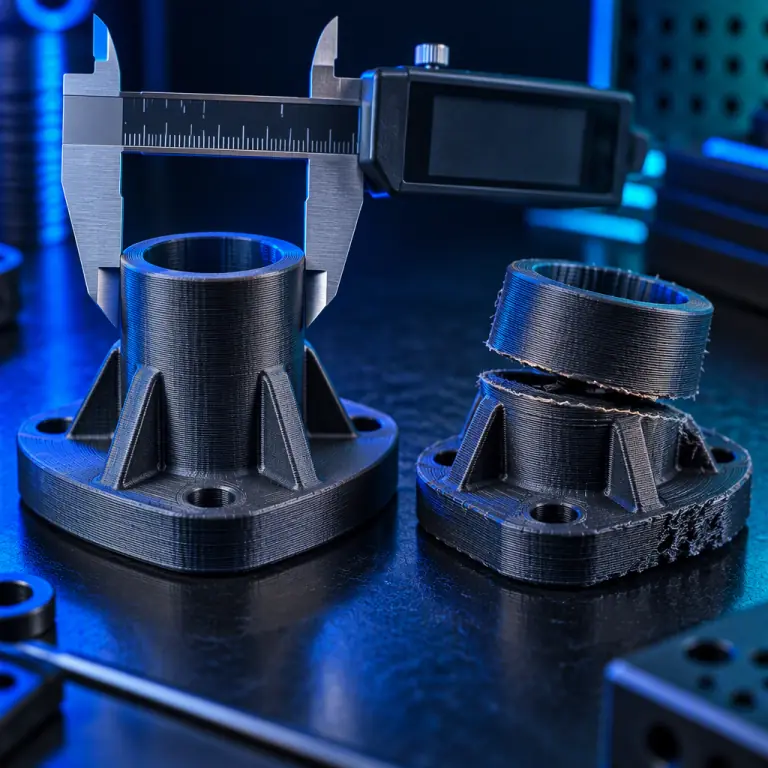
Once cost of poor quality is calculated, the allocation decision becomes arithmetic rather than opinion. The general result across manufacturing is consistent and worth stating plainly: prevention spending has the highest return, appraisal spending has a moderate return, and internal failure spending has almost none because it resolves events rather than causes.
- Where external failure dominates: the escape detection is broken. Spend on inspection method and on the controls that catch a defect before shipment, not on more reprinting capacity.
- Where internal failure dominates: the process is not capable or not controlled at the point of creation. Spend on parameter characterisation and on control-plan adherence.
- Where appraisal dominates: quality is being inspected in rather than built in. The expensive inspection step is usually compensating for a process whose variation is too wide.
- Where prevention dominates and failure cost is low: the operation is in the desired state. Maintain it, and re-check that the input assumptions still hold.
The fourth case is worth guarding, because prevention spending is only valuable while the underlying failure modes are correctly ranked. A control plan or FMEA that has not been reviewed since a machine, material or geometry change is describing a process that no longer exists. The review-trigger discipline that keeps the ranking live is set out in our FMEA and control plan guide, and the evidence package customers in regulated supply chains will demand is described in our PPAP guide.
What you're looking for: An answer naming one of the three, with a described corrective action and a date, means the operation has a functioning closed loop. An answer that describes only reprinting or apologising means the complaint was contained and the category left open.
Precise3D on Measured Quality Cost
At Precise3D, quality cost is a tracked production metric rather than a reporting afterthought. Our 3,500 sqm Shenzhen production network logs non-conformance events against a defined cost model that includes machine time and technical labour, not material alone, and reviews prevention versus failure spend on a fixed cadence. That is the same cost structure we hand to distributors, so a customer conversation about warranty or service levels starts from a shared definition of what a failure costs.
Our Pro X1 and OpenSource1 platforms pair a 320°C hotend with an actively controlled heated chamber and a rigid frame, which is what makes a documented control plan enforceable rather than aspirational — a chamber that holds setpoint removes one common cause of variation and stops it appearing in complaint data as an unexplained defect. Every unit ships with CE LVD (EN 62368-1:2014+A11:2017) and RoHS (EU 2015/863) documentation, and we supply distributors with build-log formats, spares lists and maintenance intervals so field failure data can be analysed rather than merely recorded.
Reviewed by the Precise3D quality and engineering team. Cost rates, ratios and framework guidance described here are industry-typical ranges provided for guidance and are not a guarantee of performance or savings for any particular operation. Validate against your own accounting policies, application requirements and regulatory obligations before implementation.

Measuring Quality Cost?
Want the Cost of Poor Quality Worksheet and 8D Template?
Tell us what you print and where failures are showing up. We will send the cost roll-up worksheet we use internally, including the machine-hour and labour rate structure, plus an 8D form laid out for additive processes so the three root causes get treated separately.