Why One-Factor-at-a-Time Cannot Find the Answer
Changing one parameter at a time is intuitive and almost always the wrong tool. The method assumes that the effect of each parameter is independent of the others, which means it can only ever find the best value of a parameter at the fixed values of everything else. If nozzle temperature and print speed interact — and on FDM machines they nearly always do, because both affect how much heat the extrudate has time to receive — then the optimum temperature found at 60 mm/s is not the optimum temperature at 120 mm/s.
The measurable cost of that blind spot is run count. A study of four parameters at three levels each, tested one factor at a time, needs 1 + 4×2 = 9 runs and produces no interaction information at all. The same four parameters in a full two-level factorial need 16 runs and produce every main effect plus all interaction terms. The factorial costs seven more builds and answers questions the one-at-a-time study cannot even ask.
The practical consequence for a distributor or a print-farm operator is that parameter troubleshooting gets misattributed. A part that delaminates is blamed on layer adhesion, when the actual driver was the chamber temperature and speed combination the operator set during a different study three months earlier. Ranking and controlling that kind of failure is the domain of a documented FMEA and control plan; finding it in the first place is the domain of DOE.
The Three-Stage Sequence That Works on FDM Machines
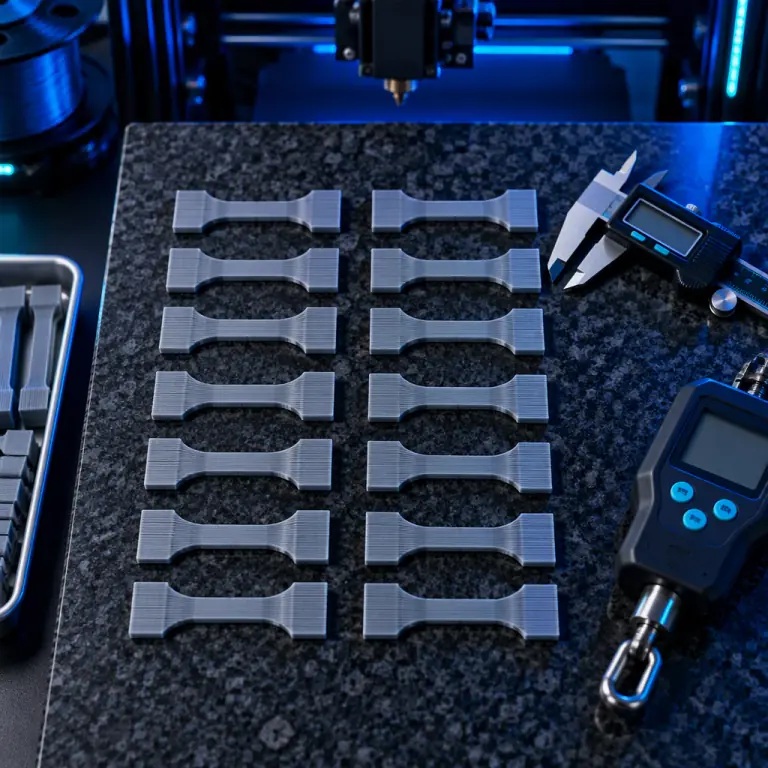
Textbook DOE assumes a process that runs unattended and produces a clean continuous response. A 3D printer fails a build outright, so the classical approach has to be adapted in one specific way: the design must survive run failures without invalidating the whole study. The sequence below accounts for that.
Stage one exists because a well-equipped FDM machine exposes far more adjustable parameters than any study can afford to test. Nozzle temperature, bed temperature, chamber temperature, flow rate, print speed, layer height, cooling fan speed, extrusion width, acceleration, pressure advance, part cooling ramp, and infill-to-perimeter overlap all move the result. Screening a wide set of factors with a deliberately small run count separates the two or three that actually move the response from the ones that can be frozen.
Stage two takes the survivors and resolves the interactions, which requires a design that is not confounded. This is the stage that answers the question the eleven-week study never could. Stage three then fits a curved surface over the two or three dominant factors so the operator can find a robust window rather than a brittle peak.
Choosing Responses: What You Actually Measure
A DOE is only as good as the response variable. Print studies frequently fail because the response chosen is convenient rather than diagnostic. Visual inspection has almost no resolution, and "looks good" is not a measurable number, which makes it useless as a response in a designed study.
Part mass is the most underrated of these. It is a direct, cheap, non-destructive measurement of how much material actually left the nozzle, and it detects under-extrusion and wet-filament effects that look identical to the eye. A study that records mass on every run gets a free second response at no additional build cost. The systematic measurement methods for the dimensional responses are covered in our part metrology guide, and the surface responses in our surface roughness measurement guide.
Reading an Interaction Term
An interaction exists when the effect of one factor depends on the level of another. In DOE output it appears as a product term — temperature × speed, flow × layer height — and its significance is tested exactly like a main effect. The reason interactions matter more than main effects in print optimisation is that a main effect tells you which direction to move a knob, while an interaction tells you that the direction depends on where another knob already is.
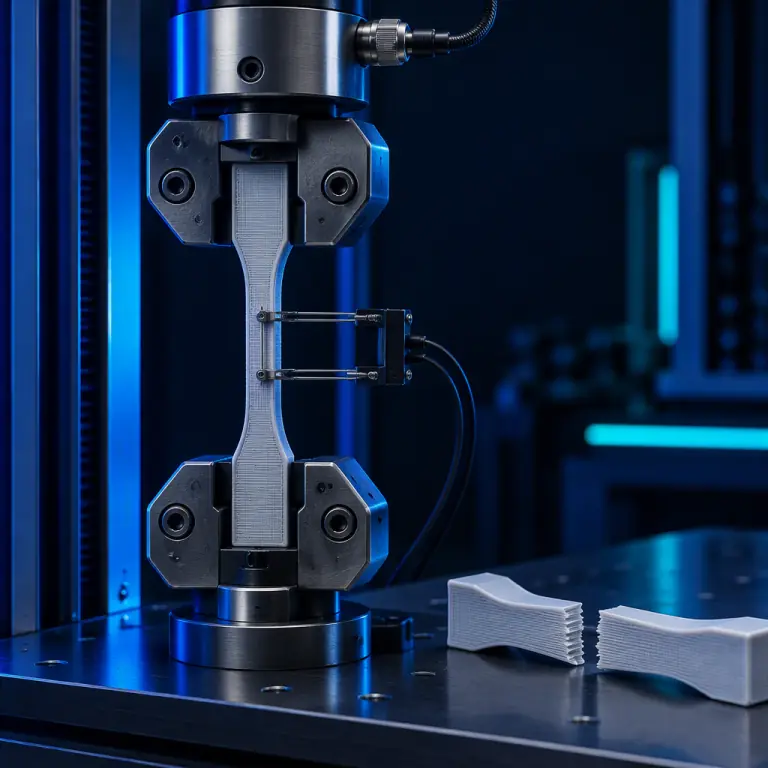
A worked reading of a two-factor interaction: suppose a study finds that raising nozzle temperature from 250 °C to 270 °C improves Z-bond strength by 12% when print speed is 50 mm/s, but by only 1% when print speed is 130 mm/s. The interaction is real and it has a physical explanation — at high speed the polymer has less residence time in the hot zone, so the extra setpoint temperature does not translate into extra melt temperature. An operator who ignores the interaction and raises temperature alone will conclude that temperature "does not matter," when what actually happened is that temperature mattered only in the speed window they never tested.
What you're looking for: An answer describing a sequence of single-variable walks means the operation has no interaction information, and its parameters are probably valid only inside the narrow window where they were found. An answer describing a factor grid or a screening run means the settings have a defensible window, and that the operation can re-optimise quickly when material or geometry changes.
Blocking and Randomisation on a Real Machine
FDM machines drift. A hotend that has run for six hours is not the same instrument as a cold one, and a study that runs all its high-temperature builds on Monday and all its low-temperature builds on Tuesday has confounded temperature with whatever else changed overnight. Two classical techniques prevent that.
- Randomise the run order. Do not sort builds by a factor level. Random order converts any slow drift into noise spread across the design rather than a systematic bias on one factor.
- Block what you cannot randomise. If a nozzle change is required, or a spool change, or a different machine, treat that as a block and balance the factor levels within each block. Blocking removes the block effect from the error estimate instead of letting it inflate the residual.
- Include centre points. Two or three runs at the middle of every factor's range give a check on curvature and a repeatability estimate. If centre-point runs scatter more than the effect you are trying to detect, the study cannot resolve that effect regardless of the design.
The repeatability point is where most in-house studies collapse, and it is the same discipline that governs production reliability measurement. A machine whose run-to-run variance is not characterised cannot support a useful DOE, which is why reliability and uptime measurement comes before aggressive parameter optimisation.
Sample Size, Power and the Cost of a Wrong Conclusion
A two-level factorial with no replication gives a single estimate of each effect and no independent error term. That is acceptable for screening, where the designs are chosen so high-order interactions can be pooled as an error estimate, but it is not acceptable for a confirmation run. The reason is asymmetry of consequence: a false positive costs one wasted parameter change, while a false negative on a safety-relevant characteristic ships defective parts to a customer.
Where the response is a safety or regulatory characteristic, formal validation replaces optimisation. That is a different exercise with a defined protocol and acceptance criteria, and the sequence for it is set out in our end-use component qualification protocol. For customers serving automotive or industrial accounts, the evidence package that must accompany validated parameters is described in our PPAP guide.
Turning a One-Off Study into a Standing Capability
The value of DOE is not a single tuned parameter set. Parameter sets go stale — a new filament lot, a new nozzle geometry or a new part orientation invalidates the optimum. The durable output is a repeatable internal capability, and four things make it durable.
- A response measurement that does not depend on a person's judgement. Calipers, a scale and a roughness gauge beat an experienced eye, because they are reproducible by the next operator.
- Build logs that record the actual factor levels. A designed study is worthless if the machine did not do what the run sheet said. Log chamber temperature and flow at minimum.
- A frozen baseline per material and geometry class. Optimise once per class, not once per part number, or the study count grows without bound.
- A retest trigger. A new spool lot, a nozzle change or a machine service reopens the study at stage two rather than stage one.
This is the same measurement discipline that underpins dimensional capability. Once a process is characterised, the variation it can hold becomes the tolerance it can be quoted against, and the compensation logic for that transfer is covered in our post-processing tolerance compensation guide. The statistical structure behind a documented quality plan is covered in our FMEA and control plan guide.
What you're looking for: A described retest procedure with a defined response and a defined threshold means the operation owns its process. An answer of “we would notice if parts started failing” means the process is being monitored by customer complaints, which is the most expensive possible sensor.
Precise3D on Characterised Process Windows
At Precise3D, parameters are treated as a documented deliverable rather than a starting guess. Our 3,500 sqm Shenzhen production network qualifies each machine class against a defined response set before release, recording dimensional deviation, part mass and Z-bond strength across the operating window rather than at a single setpoint. That is the same characterisation structure we hand to distributors, so a customer's first study starts from a known baseline instead of from zero.
Our Pro X1 and OpenSource1 platforms pair a 320°C hotend with an actively controlled heated chamber and a rigid frame, which is what makes a designed study reproducible in the first place — a chamber that actually holds its setpoint means the factor you wrote on the run sheet is the factor the machine delivered. Every unit ships with CE LVD (EN 62368-1:2014+A11:2017) and RoHS (EU 2015/863) documentation, and we supply distributors with the sensor mappings, temperature logs and spares lists that let a parameter study be audited later.
Reviewed by the Precise3D engineering team. Run counts, factor ranges and replication guidance described here are industry-typical ranges provided for guidance and are not a guarantee of performance for any particular machine, material or application. Validate all parameters against your own application requirements, customer specifications and regulatory obligations before implementation.

Optimising Print Parameters?
Want the DOE Run-Sheet Templates for FDM Parameters?
Tell us what material and geometry you are tuning. We will send the screening and factorial run-sheet templates we use internally, plus the baseline parameter windows our machines are characterised at, so your first study starts from a documented process instead of a cold machine.