
Why Once-a-Year Counting Fails
An annual physical inventory has three structural weaknesses, and none of them are about the accuracy of the counting team. It is a lagging measurement, so errors are found an average of six months after they were created, long after any chance of identifying the transaction that caused them. It is an averaging measurement, which means a warehouse can hit 98% while the specific items its customers order most often are persistently wrong. And it is a costly measurement, because production or shipping typically stops for it, which creates pressure to complete it quickly rather than diagnose it.
The consequence is that the annual count produces a financial adjustment rather than an operational improvement. The books are corrected, the cause is not identified, and the same transactions generate the same errors over the following twelve months. Cycle counting exists to break that loop by measuring often enough that the transaction is still traceable.
The negative-stock report deserves more attention than it usually gets, because it is the only error signal that costs nothing to produce. A system showing −3 units on hand is reporting a transaction error with certainty: either a receipt was never recorded or an issue was recorded twice. Any warehouse with a rising count of negative-stock incidents has a receiving or issuing problem that it is not looking at. The same cash-flow consequence runs the other way as well — excess stock tied up against an inflated record depresses the working capital position, which is covered in our distributor cash flow management guide.
Classifying Stock So the Count Schedule Follows the Money
Counting everything at the same frequency wastes the counting effort on items whose error has no consequence. ABC classification directs the effort at the items where an error actually costs money, and the classification should be driven by consumption value rather than unit price alone.
The cadence column is a starting point, not a rule. A useful refinement is to count an item immediately after it has been transacted, in a small quantity, which tests whether the transaction was recorded correctly rather than merely testing what is on the shelf. This is often called a transaction-based cycle count, and it is the only version that can attribute an error to a specific person and process.
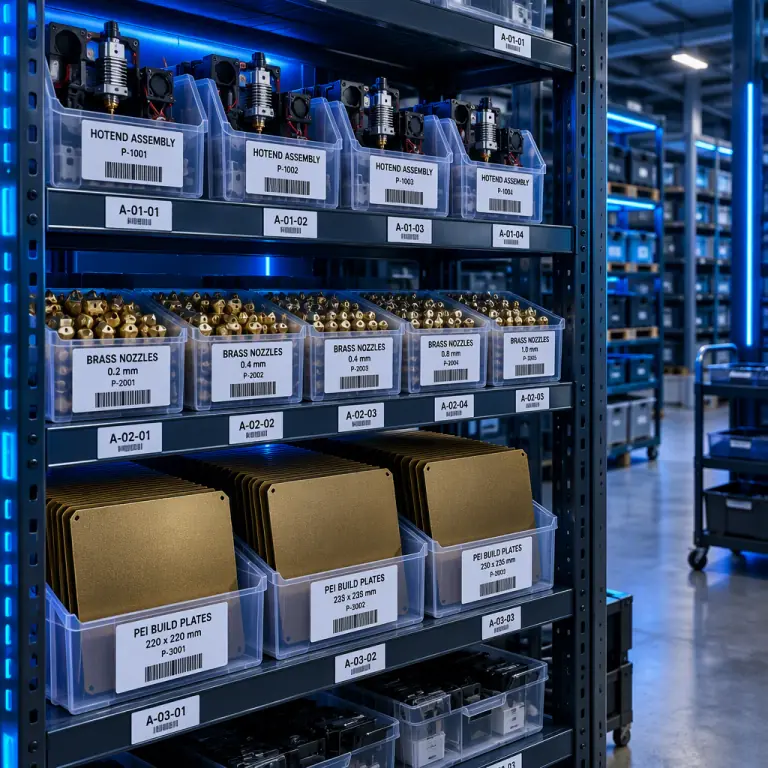
Classification also has to reflect the physical reality of a parts business. Consumables such as nozzles and filament may be low value per unit but very high in movement count, which means their transaction error rate is high even though their financial value is low. A nozzle shortage stops a customer's machine just as effectively as a board-level shortage. That is an argument for counting high-velocity, low-value items on a velocity basis in addition to the value basis.
What you're looking for: Stockouts concentrated in A items means the counting or replenishment logic for the highest-value stock is the problem. Stockouts in C items that were never counted means the schedule is misdirected. Stockouts in fast-moving low-value consumables means the classification is on value alone and needs a velocity dimension added.
The Transaction Errors Behind Phantom Stock
Inventory records diverge from reality through a limited number of mechanisms, and each has a specific fix. Diagnosing which mechanism dominates is what makes cycle counting worth the labour, because addressing the wrong one leaves the error rate unchanged.
Two of these are worth singling out for parts businesses. The unit-of-measure error is the single largest cause of catastrophic discrepancies, because a factor-of-ten or factor-of-twenty error is large enough to be noticed only when someone tries to pick against it. It is also entirely preventable by fixing the unit of measure at SKU creation and never allowing a transaction in a different unit. The substitution error is subtler: an operator who knows that two nozzles are interchangeable will issue the one in their hand rather than walk to the correct bin, and the record then diverges on both SKUs simultaneously while the physical parts still look right.
Returns are the third area where parts businesses lose accuracy, because reverse logistics has more handoffs than forward logistics. The structure for handling returns so that the credit to stock actually happens is covered in our warranty returns and reverse logistics guide.

Setting Reorder Points That Survive Real Demand
Cycle counting finds errors. Reorder points stop the errors from becoming stockouts, but only if they are calculated from measured demand and measured lead time rather than from intuition. The formula is straightforward, and the reason it is so often wrong is that one of its inputs is a guess.
The lead-time input is where most systems are quietly wrong. The quoted lead time from a supplier is the promise; the actual lead time includes booking, consolidation, freight and customs, and it is usually the larger number. A distributor measuring actual receipt dates against promised dates will typically find the real lead time is longer and more variable than the quote, and both facts push the reorder point upward. Our shipping and logistics guide covers the stages that accumulate that time.
Safety stock should be sized to variability rather than to a flat number of weeks, because a flat rule gives the same protection to a stable consumable and to a seasonal item. The mechanics of sizing that buffer, and the demand forecasting discipline that feeds it, are covered in our inventory management and SKU planning guide. For items whose demand is genuinely seasonal, the planning approach is set out in our seasonal inventory planning guide.

Making the Count Affordable
Cycle counting fails in small and mid-size operations for a practical reason: it competes with shipping for the same labour. The design of the programme has to acknowledge that, or it will be abandoned in the first busy week.
- Count in small quantities, often. Fifteen minutes a day beats a full day once a quarter, and it fits around order flow rather than blocking it.
- Count by location, not by SKU list. A counter working a bin location finds misplacements, which a SKU-ordered list cannot.
- Freeze the SKU during the count. If transactions continue while counting, the count is invalid before it finishes. The simplest control is to count before the shift starts or immediately after a pick is completed.
- Record the cause, not just the variance. A variance of −5 with no cause is a data point that will repeat next month. A variance coded as “unrecorded issue, door left unlocked” is a finding that can be closed.
- Escalate by value, not by percentage. A 40% error on a €3 item matters less than a 2% error on a €900 unit. Rank by the money, and investigate in that order.
The fifth point determines whether the programme survives. An operation that investigates every variance with equal urgency will spend its most expensive attention on its cheapest problems, and the people running the programme will conclude that cycle counting generates work rather than preventing it. The escalation should be financial.
What you're looking for: A described corrective action with an owner and a date means the programme is doing its job. An answer of “it was counted and the system was updated” means the count is correcting records without correcting causes, and the same variance will be counted again next cycle.
Precise3D on Parts Availability
At Precise3D, spare parts availability is treated as a service commitment rather than a stock-keeping afterthought. Our 3,500 sqm Shenzhen production network holds service parts against a classified plan, with counting cadence set by consumption value and by whether a shortage would stop a customer's machine. That is the same structure we recommend distributors run on their own shelves, because a machine that is idle for a €12 nozzle is the most expensive kind of downtime.
Our Pro X1 and OpenSource1 platforms pair a 320°C hotend with an actively controlled heated chamber and a rigid frame, which is what makes a parts plan meaningful over a multi-year horizon — a platform whose geometry and electronics stay stable does not obsolete its own spares list. Every unit ships with CE LVD (EN 62368-1:2014+A11:2017) and RoHS (EU 2015/863) documentation, and we supply distributors with spares lists, consumption-rate guidance and maintenance intervals so a reorder point can be calculated from data rather than estimated.
Reviewed by the Precise3D operations team. Counting cadences, classification thresholds and reorder-point inputs described here are industry-typical ranges provided for guidance and are not a guarantee of performance for any particular operation. Validate all inventory parameters against your own demand history, supplier lead times and commercial obligations before implementation.

Tightening Inventory Control?
Want the Cycle Count Schedule and Reorder Point Template?
Tell us what parts you stock and how often you run out. We will send the ABC classification worksheet and reorder point template we use internally, plus the consumption-rate data for our service parts so your safety stock is sized against real demand rather than a flat rule.