

Cash flow kills distributors. Not competition. Not tariffs. The single most reliable predictor of failure across thirty-plus markets: the distributor who understands their cash conversion cycle survives; the one who treats the bank balance as a proxy for business health does not. A distributor with $2 million in annual revenue and a 90-day cash conversion cycle needs approximately $500,000 in working capital just to stay current — and most start with less than half that. This guide maps every lever: payment terms with factories, financing instruments, working capital optimization, regional payment norms, and the pricing discipline required when extending credit to customers.
The Three Cash Flow Challenges Specific to 3D Printer Distribution
Distribution businesses share common cash flow dynamics, but 3D printer distribution has three structural challenges that make the problem more acute than in most B2B wholesale categories:
1. The inventory carrying cost trap. Each printer unit represents $300–2,500 in tied-up capital. A mid-size distributor placing a $120,000 mixed container order has that capital frozen for 45–60 days during production and ocean freight, then another 30–90 days selling through stock — a total lock-up of 75–150 days. At 8% cost of capital, that single container costs $1,600–3,200 in financing drag before a single unit ships to a customer. When three parallel containers run simultaneously — one in production, one in transit, one in warehouse — the drag triples. Our inventory management and SKU planning guide provides the stock-level frameworks that feed cash flow optimization.
2. The supplier-customer payment terms gap. Chinese 3D printer manufacturers, particularly mid-tier and smaller factories, operate on prepayment terms: T/T 30/70 is the industry standard — 30% deposit to start production, 70% balance before shipment. This means the distributor has paid 100% of the landed cost before the goods leave the factory in Shenzhen. Meanwhile, the distributor's B2B customers — resellers, schools, print farms, manufacturers — expect 30-day net terms as a baseline, 60–90 days in many markets. The result: a negative cash conversion cycle where the distributor finances the entire supply chain for 60–120 days. Our OEM pricing and factory negotiation guide covers the leverage points for improving these terms.
3. Seasonal demand with lumpy inventory replenishment. 3D printer sales surge in Q4 (holiday demand, year-end budget spend), dip in Q1, and grow steadily in Q2–Q3. But ocean freight and production lead times force orders 8–12 weeks ahead of the demand curve. A distributor ordering for Q4 in August is making a $150,000 bet on demand that won't materialize for four months. When the bet is wrong, overstock creates a cash crunch that can take two quarters to unwind. The risk is amplified by minimum order quantities: factories requiring 50–100 units per SKU force inventory positions that are difficult to adjust mid-cycle. Our shipping and logistics guide details the lead time planning that reduces seasonal risk.
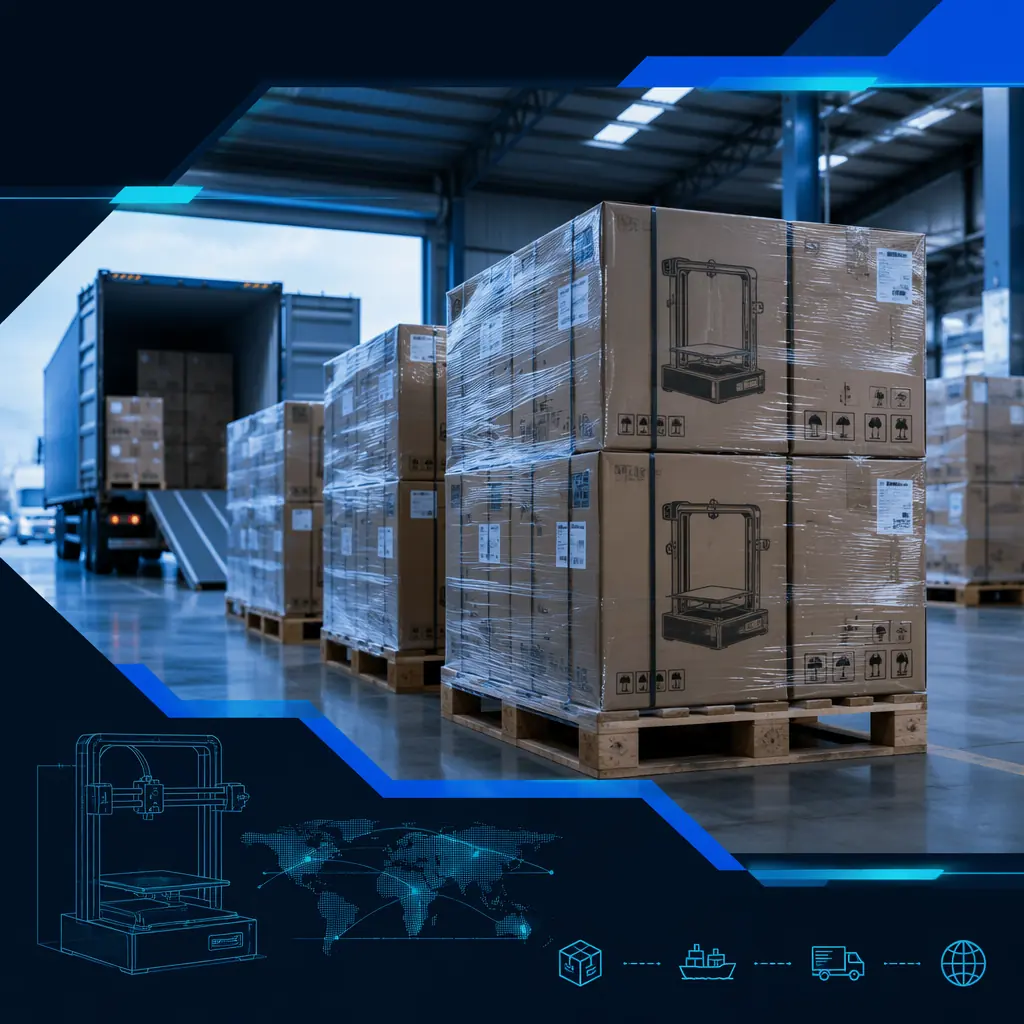
The Cash Conversion Cycle: DIO, DSO, DPO — The Three Numbers That Define Your Liquidity
The cash conversion cycle (CCC) measures how many days your cash is tied up in operations before returning to your bank account. It is the sum of three metrics:
A distributor with 70 days DIO, 45 days DSO, and 20 days DPO has a CCC of 95 days. On $2 million in annual revenue, that means approximately $520,000 in working capital is continuously tied up in the operational cycle. Reducing the CCC by 20 days — through a combination of faster inventory turns, tighter collections, or extended supplier terms — frees approximately $110,000 in working capital without raising a dollar of external financing.
How to reduce DIO: The fastest lever is SKU rationalization — identify the bottom 20% of SKUs by revenue and liquidate them. The second lever is order frequency: switching from quarterly $120,000 container orders to monthly $40,000 LCL shipments reduces average inventory by roughly 40%, cutting DIO from 70 to 42 days. LCL freight costs more per unit, but the working capital savings typically exceed the freight premium 3–5x. The third lever is consignment with large repeat B2B customers — warehousing 20 units at a customer's facility reduces your holding cost while guaranteeing throughput.
How to reduce DSO: Offer a 2% early-payment discount for settlement within 10 days (2/10 net 30). A 2% discount costs $20 per $1,000 invoice but accelerates cash by an average of 25 days — equivalent to a 29% annualized return. For late payers, implement 1.5% monthly penalty on balances past 30 days. Most importantly, make payment frictionless: automated invoicing with embedded payment links reduces DSO by 7–12 days versus manual invoice-and-wire-transfer workflows. Our financial KPI benchmarking guide provides the full metrics to track alongside the CCC.
Inventory Financing Options: PO Financing, Warehouse Lines of Credit & Supplier Credit
External financing is not a sign of weakness — it is a tool for breaking the cash conversion cycle constraint during growth. The three instruments most relevant to 3D printer distributors, in order of accessibility:
Purchase Order (PO) financing. The lender pays the supplier directly (70–100% of supplier cost) when the distributor lacks working capital for a confirmed order, and is repaid when the end customer pays. Cost: 2–5% per 30-day cycle (24–60% APR) — expensive, but viable when gross margin exceeds the financing cost. Best for distributors doing $500K–3M who land a single large order (university buying 40 printers, government makerspace contract) that would otherwise strain working capital. Our leasing and financing guide covers customer-facing financing options.
Warehouse lines of credit. A revolving facility secured against warehouse inventory, advancing 50–70% of net orderly liquidation value at SOFR + 3–8% (currently 7–12% all-in). A distributor with $200,000 in inventory can access $80,000–120,000 — enough for the next container deposit. Requires audited inventory reporting, but is the cheapest non-dilutive financing for distributors above $2 million in revenue.
Supplier credit (OA terms). The ideal: factory ships before payment is due. Shift from T/T 30/70 to net-30 OA eliminates 30–45 days from the CCC overnight. Chinese factories rarely offer OA to new relationships, but 12–18 months of consistent order history and on-time payments can unlock OA on a portion of volume. Start by requesting OA on the 30% deposit only, then expand. Our factory negotiation guide covers the full strategy.
Payment Term Negotiation Strategies with Chinese Factories: T/T 30/70 vs L/C vs OA
Chinese 3D printer factories default to T/T 30/70 because it eliminates their credit risk — they are paid before the goods leave their control. The distributor's goal is to shift the risk-reward equilibrium toward terms that reduce their own working capital burden without making the factory uncomfortable. Here is how each instrument works in practice and when to deploy it:
T/T 30/70 (Telegraphic Transfer). The baseline: 30% deposit at order placement, 70% before shipment. On a $100,000 order, $100,000 is committed before the container departs — the worst-case for distributor cash flow. Negotiation leverage: offer increased order frequency (monthly vs quarterly) or a 12-month volume commitment in exchange for T/T 30/50/20 — 30% deposit, 50% on shipment, 20% net-30 after receipt. This keeps the factory's risk contained (80% collected before goods leave) while reducing the distributor's pre-receipt exposure by $20,000 per $100,000 order.
L/C at sight (Letter of Credit). The distributor's bank issues an irrevocable payment guarantee. The factory ships, presents documents to the bank, and receives payment. The distributor pays upon document arrival — shifting payment timing from "before shipment" to "upon shipment," a net improvement of approximately 15 days. Cost: 0.5–1.5% of transaction value plus bank fees. Many factories accept L/C from established distributors but may charge 1–2% more per unit for the documentation overhead.
OA (Open Account — net 30/60/90). The factory ships with payment due after an agreed period. OA requires: (a) 6–8 completed transactions with zero delays, (b) audited financials showing a current ratio above 1.5x, and (c) a volume commitment justifying the credit. Shifting from T/T 30/70 to OA net-30 reduces the distributor's CCC by approximately 45 days — the single most powerful cash flow lever available.
Practical negotiation framework: Enter with data, not requests. Show the factory your purchase history, payment record (zero late payments), growth trajectory, and a 12-month volume commitment. Frame the ask as a partnership investment: "We are projecting $500,000 in orders over the next 12 months. If we can move to OA net-30 on the balance portion, we commit to monthly $40,000+ orders instead of quarterly $120,000. The higher frequency benefits your production scheduling; the credit terms benefit our working capital. Here is a bank reference letter and our last two years of financials." Factories respond to certainty and volume.

Regional Payment Realities: What Your Customers Actually Pay (and When)
Payment norms vary dramatically by region, and a distributor who prices credit terms uniformly across markets is leaving margin on the table in some regions while underpricing risk in others:
The LATAM reality check: A distributor selling into Brazil, Mexico, or Colombia who quotes net-30 and budgets for 30-day collection will run out of cash. Actual DSO in LATAM B2B averages 65–110 days, driven by bureaucratic approval processes, currency controls, and payment culture. The solution: add a 5–8% credit premium to LATAM invoices and hedge currency exposure through forward contracts. Our pricing and margin strategy guide details region-specific pricing frameworks.
The EU advantage: Western European B2B buyers are the most disciplined payers globally — a net-30 invoice in Germany or the Netherlands typically pays within 28–32 days. This reliability means EU-focused distributors can operate with tighter working capital reserves and lower financing costs, a structural advantage that compounds into higher net margins over time.
Working Capital Optimization: Techniques That Free Cash Without External Financing
Before pursuing external financing, exhaust the internal levers that generate working capital from existing operations:
1. Deposit-based pre-sales for new model launches. When launching a new printer model, collect 20–30% deposits from existing customers 4–6 weeks before the container arrives. This generates $20,000–60,000 in customer-funded working capital per launch and validates demand before committing to full production. Frame it as "early access" or "priority allocation."
2. Consumables subscription programs. A filament subscription billed monthly and shipped quarterly generates negative working capital — the customer pays before the distributor orders from the supplier. At $80/month with 100 subscribers, that is $96,000/year in working capital flowing before any COGS is incurred. This is the single most underutilized cash flow tool in distribution. Our consumables subscription guide provides the implementation playbook.
3. Just-in-time (JIT) inventory for fast-moving SKUs. The top 5–8 filament colors and most popular printer models can be reordered weekly from the OEM or a regional consolidation hub, reducing safety stock by 60–70%. JIT requires reliable freight partners and a factory willing to hold buffer stock — both achievable with volume commitment. The tradeoff: higher per-unit freight cost in exchange for dramatically lower inventory carrying cost. Our import and customs guide covers the freight and duty planning that makes JIT viable.
4. Factoring receivables. Selling AR at a 2–4% discount converts 60-day DSO into immediate cash. Expensive as a permanent solution but effective as a bridge — use selectively on the 20% of slowest-paying receivables. Compare the factoring cost against the opportunity cost of turning down orders: factoring a $50,000 receivable at 3% to fund a $50,000 order at 35% gross margin generates $17,500 GP for a $1,500 fee.
Cash Flow Forecasting: The Template Approach That Prevents Surprises
Cash flow forecasting in 3D printer distribution follows a predictable pattern, and the template is simpler than most distributors assume. The goal is not precision to the dollar — it is visibility into the week when the bank balance drops below the critical threshold so you have time to act before it happens.
The 13-week rolling forecast template:
Inflows: Expected customer payments grouped by probability — "confirmed" (AR due this week), "likely" (AR due next week, historically on-time), and "possible" (new orders expected to close). Track "possible" separately; don't include it in cash-on-hand.
Outflows: Factory deposits and balance payments (keyed to PO dates), freight and customs (keyed to vessel arrival), operating expenses (payroll, rent, marketing), and tax obligations (quarterly — often the surprise shortfall).
Net position: Starting cash + inflows − outflows = ending cash per week. Flag any week where ending cash drops below 2× weekly operating expenses as the "action required" threshold.
Scenario modeling: Maintain three versions — base case (expected sales velocity), downside (30% slower sales, 15-day longer DSO), and upside (20% faster sales). The downside scenario tells you the maximum working capital requirement; the upside scenario tells you the opportunity cost of under-ordering. Update all three weekly. Our TCO and ROI calculator guide provides the unit economics modeling that feeds into the forecast.
Margin-Preserving Pricing When Offering Credit Terms
Extending credit to customers is a pricing decision, not a courtesy. Every day of credit you extend has a calculable cost, and that cost must be embedded in your pricing or you are silently eroding margin. Here is the framework:
Calculate the daily cost of credit. Your cost of capital (weighted average of any debt and the opportunity cost of equity) divided by 365 gives the daily financing cost per dollar of outstanding receivables. At an 8% cost of capital, each $1,000 in receivables costs $0.22 per day. Net-30 terms on a $10,000 invoice cost approximately $66 in financing drag. Net-60 terms cost $132. Net-90 terms cost $198. These numbers are small per invoice but compound meaningfully across hundreds of invoices — a distributor carrying $300,000 in average receivables at 8% cost of capital spends $24,000/year financing customer credit.
Build the credit cost into your pricing tiers:
Pricing tactics that preserve margin while accommodating customer needs:
Discount for early payment instead of surcharging for credit. Frame the decision as a reward for prompt payment rather than a penalty for credit: \"List price: $10,000. 3% discount for payment within 10 days. Net 30 standard.\" This is psychologically more palatable than \"Net 30 price: $10,300, cash price: $10,000\" even though the economics are identical. The early-payment discount also reduces DSO organically — customers self-select into faster payment to capture the discount.
Tiered credit based on order size and relationship history. New customers: prepaid or COD only for the first two orders. After $10,000 in cumulative purchases with on-time payment: Net 15. After $25,000: Net 30. This gates credit exposure behind demonstrated behavior and limits the cost of a bad debt to the first two transactions. For large institutional orders (universities, government contracts) that require net-60 or net-90 by law or policy, negotiate a higher unit price that embeds the credit cost — these buyers are less price-sensitive on individual line items and more concerned with process compliance.
Use trade credit insurance for high-risk markets. Export credit insurance (Euler Hermes, Atradius, Coface, national ECAs) covers 85–95% of the invoice value in the event of default. Premiums range from 0.3–1.5% of insured revenue. For a distributor selling $500,000/year into LATAM or Africa on 60–90 day terms, credit insurance at 0.8% costs $4,000/year — a fraction of the potential loss from a single $50,000 default. Build the premium into the regional pricing premium alongside the financing cost. For broader financial strategy, see our M&A and exit strategy guide — cash flow discipline is what makes your business acquirable.
Bottom Line
Cash flow management in 3D printer distribution reduces to five disciplines: know your cash conversion cycle and track it monthly, negotiate supplier terms relentlessly as your purchase volume grows, finance inventory through the right instrument for your stage (PO financing early, warehouse lines at scale, supplier credit as the end state), price credit terms into your margins so you never subsidize your customers' working capital, and maintain a 13-week rolling forecast that gives four weeks of visibility into any cash shortfall. A distributor who masters these disciplines operates with 30–40% less working capital than a same-revenue competitor who does not — and that capital efficiency compounds into higher margins, faster growth, and a more valuable business at exit. For the foundational metrics, revisit our financial KPI benchmarking guide. For new distributors, start with our startup guide for new distributors.
Start Your Partnership
Ready to Build a Financially Resilient Distribution Business?
Join our network of 200+ global distributors. Competitive pricing, flexible order quantities, and dedicated support from a team that understands the financial realities of distribution.