What Bridge Production Actually Is
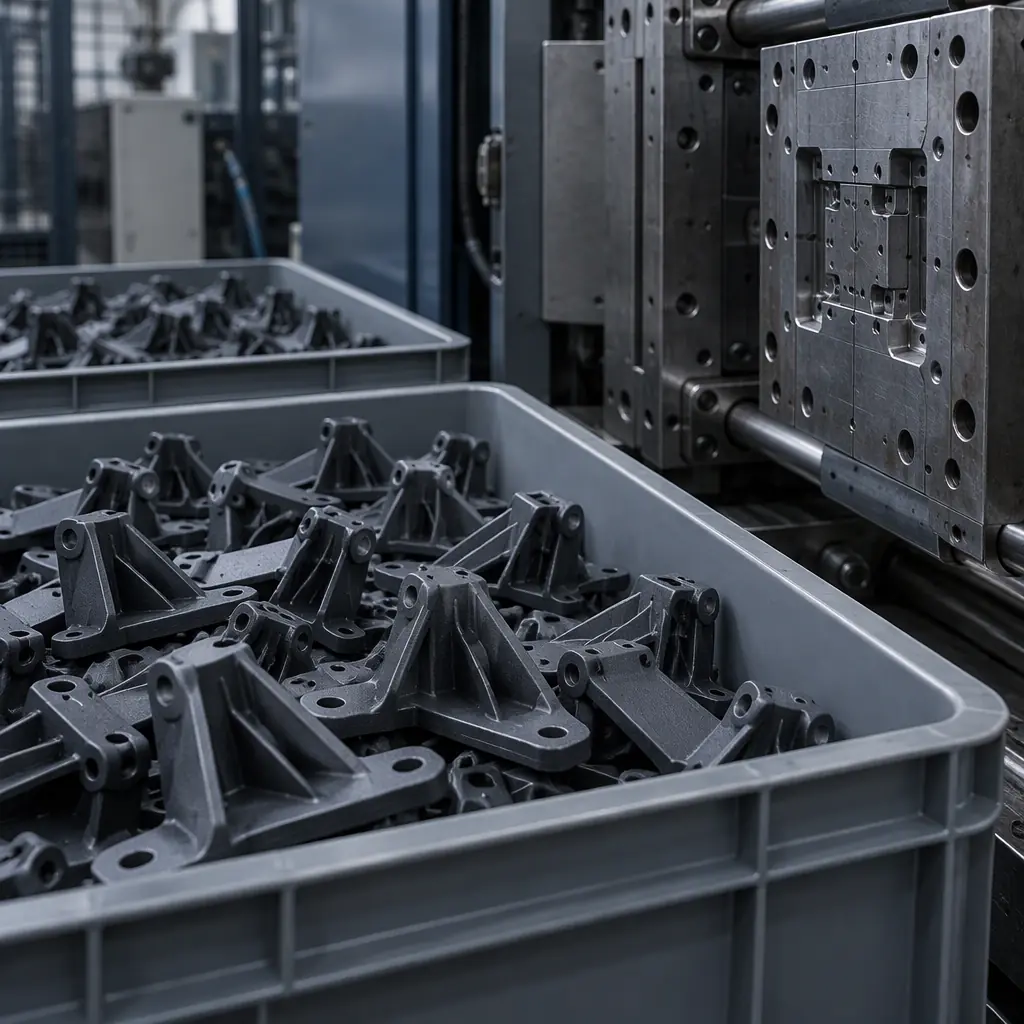
Bridge production is the use of a process that is not the intended volume process to supply real saleable product between the end of pilot builds and the start of moulded or cast volume. Printed parts are the most common bridge in low and medium volume programmes because the tooling is free, the lead time is days, and the design can still move. What makes it a discipline rather than a service label is that the bridge has a defined exit: a volume threshold, a quality gate and a tooling spend schedule agreed before the first order.
Without that exit, the bridge becomes the plan. This is the failure pattern that repeats across programmes: the printed part is specified as temporary, nobody defines what temporary means, volume arrives in three steps instead of one, and the programme ships printed parts for two years at a unit cost the business case never modelled. The supplier is not at fault; the agreement had no gate in it.
The opposite failure costs more. Tooling is cut on a forecast, the forecast is wrong by forty percent, and the mould sits in a rack while the printed line keeps running because it is the only thing that can flex. Both failures are the same failure: the switch point was treated as a judgement call rather than as arithmetic.
The Three Curves That Decide the Switch Point
The switch point is the volume at which the total cost of the printed route and the total cost of the tooled route cross. Three curves produce it, and each one behaves differently as volume rises.
The printed cost curve. Printed cost per part is nearly flat with volume, because most of it is material, machine time and labour per part, and the fixed component is small. It falls modestly at higher volume as nests fill better and plate utilisation improves, typically ten to twenty percent between one-off and steady state, and then stops falling. There is no economy of scale in a print farm beyond utilisation.
The moulded cost curve. Moulded cost per part is high at low volume and drops steeply, because the machine time per part is short and the setup is amortised over the run. The curve is dominated by the cycle time and the cavitation, and it is only meaningful above the volume at which the machine is worth setting up.
The tooling amortisation curve. Tooling is a step function, not a curve. One mould is one payment, spread over whatever volume follows. If that volume is smaller than planned, the per-part tooling cost rises hyperbolically, and this is the line that turns a good business case into a stranded asset.
Where the printed curve and the tooled curve cross is the break-even. Where the tooling amortisation line makes the tooled curve unaffordable at plausible volumes is the risk boundary. A bridge schedule lives between the two.
Break-Even Arithmetic With a Worked Example
The arithmetic is simple enough that there is no excuse for not running it, and the only input that is genuinely uncertain is the volume forecast. Take a 120 g bracket in glass-filled polyamide, printed at USD 8.50 per part, with a 20,000 unit annual demand and a single-cavity steel tool quoted at USD 45,000 producing parts at USD 2.40.
At 5,000 units the printed route costs USD 42,500. The tooled route costs USD 45,000 in tooling plus USD 12,000 in parts, which is USD 57,000, and the printed route wins by USD 14,500. At 20,000 units the printed route costs USD 170,000 and the tooled route costs USD 45,000 plus USD 48,000, which is USD 93,000, and the tooled route wins by USD 77,000. The crossing point sits near 7,200 units on these numbers.
Three things about that arithmetic matter more than the crossing point itself.
- Tooling dominates the low end completely. Below about 3,000 units no tooled route is defensible on cost, which is why printed parts own the pilot and early ramp and why a supplier quoting a mould at 2,000 units is quoting a decision, not a cost.
- The printed route has a cost the tooled route does not. Design changes after tooling are expensive, and in a ramp the design almost always changes. A printed bridge absorbs two or three engineering changes at material cost; a steel tool absorbs them at USD 8,000 to 25,000 each. The correct comparison includes an expected value for engineering changes, and it moves the break-even up.
- Aluminium bridge tooling changes the answer. A USD 12,000 aluminium tool at 5,000 to 30,000 units of life moves the crossing point down to around 2,500 units and lowers the risk if volume disappoints, at the cost of a shorter tool life and a second tool later.
The volume bands therefore fall into a pattern that is worth stating plainly, because it is the piece most business cases get wrong. Under 2,000 units, print. Between 2,000 and 6,000, print or aluminium bridge tooling depending on design stability and expected life. Above 6,000 with a stable design, steel. Above 20,000, steel and nothing else. Our guide to cost per part and unit economics covers the printed side of the model in detail, and the injection moulding vs printing comparison covers the technology decision that sits behind the numbers.
Phasing the Tooling Spend: A Three-Gate Model
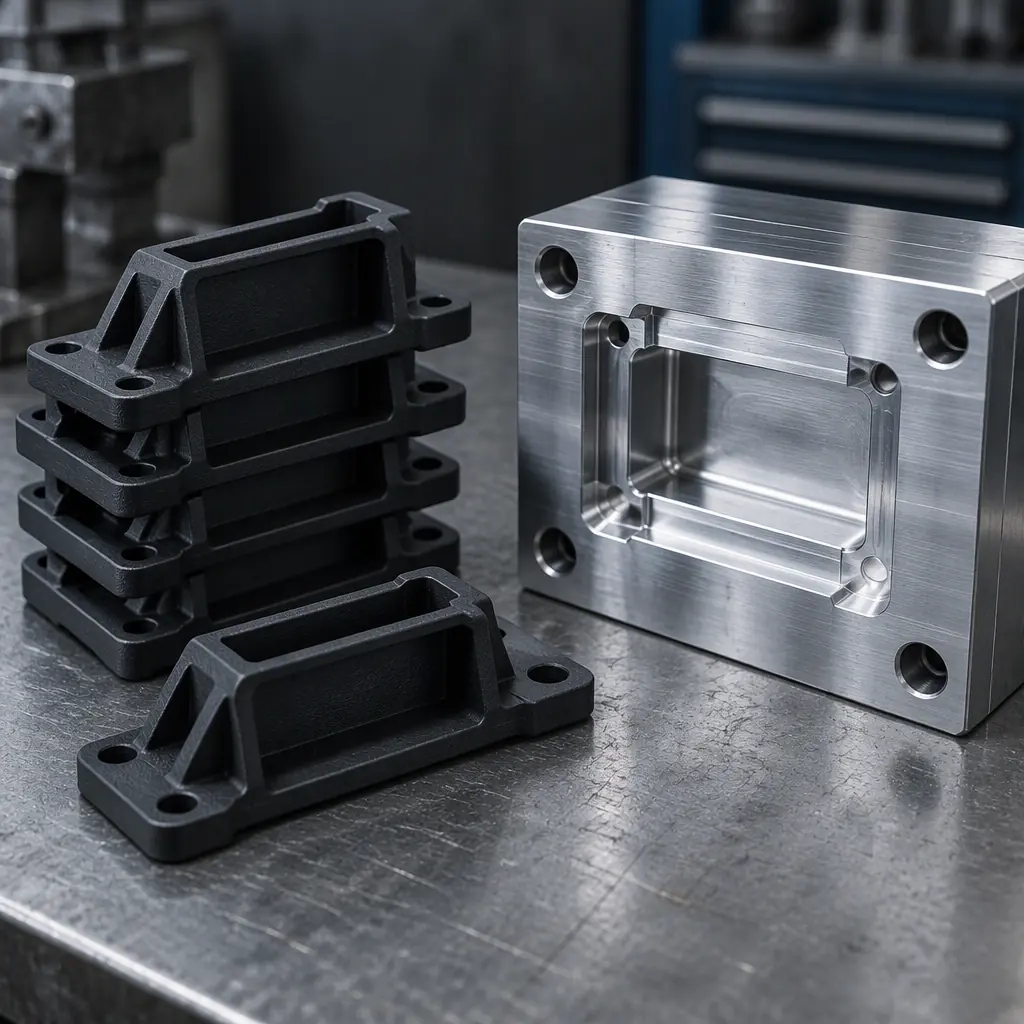
Because the volume forecast is the uncertain input, the sensible response is not to forecast better but to spend tooling money only when evidence arrives. Three gates do that, and each one has a specific piece of evidence attached rather than a date.
Gate one: design freeze. The tool is not ordered until the design has stopped moving, which in practice means a change freeze with a defined list of open items and a cost consequence for reopening them. The evidence required is a signed design record and a first-article inspection of printed parts against every drawing characteristic. This is the gate that prevents the most expensive outcome, which is a tool that produces the version before last.
Gate two: demand evidence. The tool is not ordered until demand data supports it, which for a new product means orders, not forecasts, or a forecast with a customer commitment behind it. A defensible threshold is that the tool order is triggered when cumulative confirmed demand reaches the break-even volume with a defined margin, and the bridge agreement states the trigger as a number rather than as "when volumes justify".
Gate three: quality evidence. The tool is not ordered until the printed process has demonstrated capability on the characteristics that will carry into moulding, because a design that cannot hold tolerance in one process usually will not hold it in the next for the same reason. The evidence is a pilot lot Cpk on the critical dimensions, which is covered in our guide to pilot lot Cpk validation. Where the design cannot demonstrate capability, tooling it converts a design problem into a mould problem.
Gates two and three run in parallel and gate one is a prerequisite for both. What the schedule buys is the ability to answer the only question that matters at a board review: if demand stops at half the forecast, what have we lost? With the gates in place, the answer is the value of printed inventory, which is small. Without them, it is the tool.
Why: Without the band, a supplier who quoted on an assumption of 3,000 units per month and receives 400 discovers their per-unit labour and setup assumptions are wrong, and the price reopens. With the band stated, both parties know the price applies in the range it was built for, and the trigger for volume renegotiation is a number rather than an argument at the worst possible moment.
What Changes in the Printed Process When Volume Triples
A printed process that works at 400 units a month does not simply run faster at 1,200. Four things change, and each one has to be planned rather than discovered.
Nesting and plate strategy. At low volume each part is printed with generous spacing and individual support. At higher volume the plate fills with copies, spacing narrows to the minimum that does not couple thermal shrinkage between parts, and the support strategy is standardised across the plate. This is where the ten to twenty percent cost reduction comes from, and it is also where the quality risk comes from: two parts adjacent on a plate cool differently from two parts printed alone, and the dimensional difference is measurable on tight features.
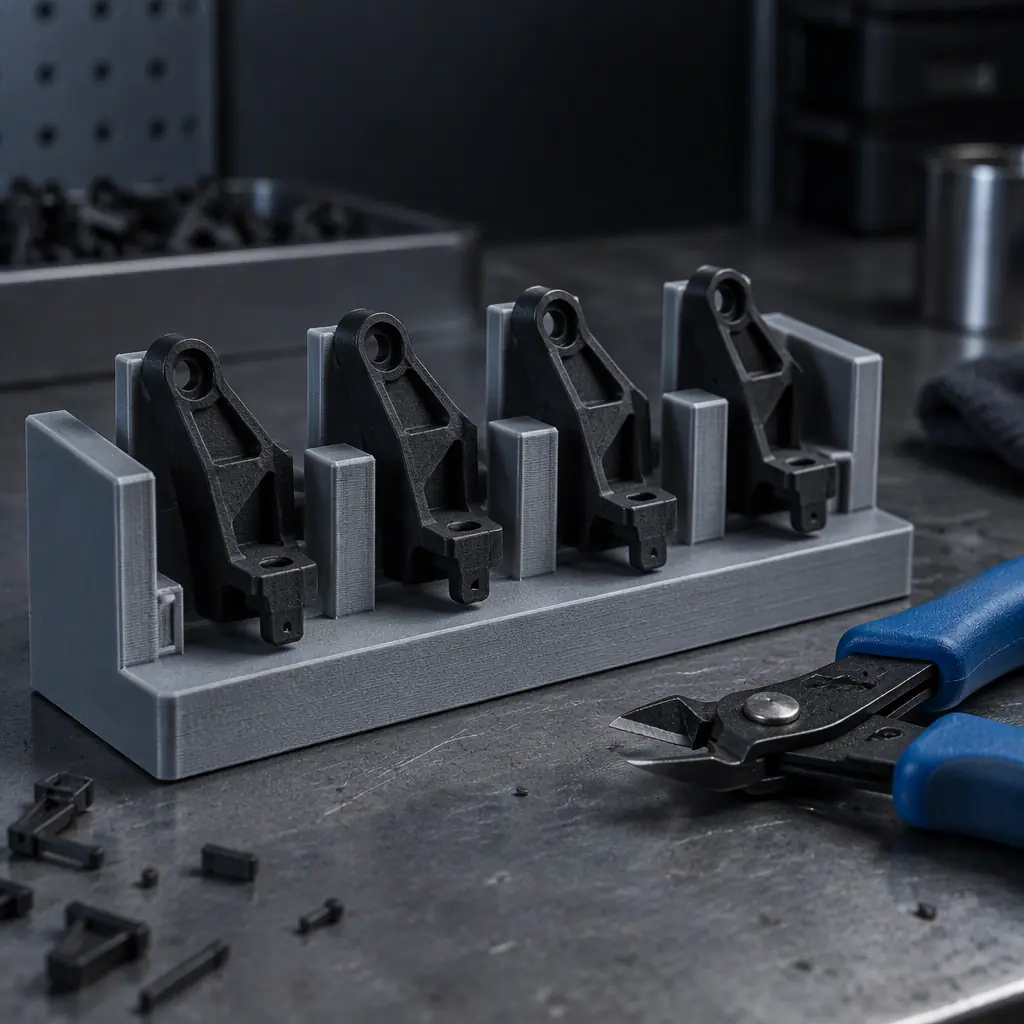
Labour per part. Support removal, inspection and packing are manual steps that do not scale automatically. At 400 units a month one person absorbs them; at 1,200 the same steps become a bottleneck unless they are batched, tooled or automated. The practical intervention is a jig that holds four parts at once for support removal, which is itself a printed part and is often the highest-return print in the whole programme. Our guide to printed jigs and the tooling library covers the pattern, and robotic tending of print plates covers the step after that.
Material control. At low volume a spool is opened and consumed within a week. At triple volume the material flows through storage faster but in more batches, and a single wet spool among ten produces a small population of weak parts that will surface as a field failure six months later. Volume is when moisture control stops being a workshop habit and becomes a recorded process step with a dryer and a log.
Machine count and scheduling. The step from one machine to three introduces cross-machine variation and scheduling trade-offs that did not exist before, and the fleet economics change shape because uptime, not headline speed, drives capacity. Our guide to print farm machine count and uptime economics works through the capacity arithmetic, and the point for a bridge is that capacity has to be contracted, not assumed.
Quality and PPAP During a Bridge
A bridge does not delay the customer's quality requirements; it changes which process supplies the evidence. If the eventual volume part is moulded, the PPAP that matters is the moulded one, and the printed parts ship under a documented bridge arrangement with their own control plan, their own capability evidence, and an explicit statement of which characteristics the printed process is certified to hold.
Three practices make the arrangement work. First, define the characteristics that must be held identically in both processes, which is usually everything the customer touches: mounting interfaces, connector positions, sealing faces. Second, define the characteristics where the printed process is expected to differ, such as surface finish or gate vestige, and get the customer's written agreement that those will change at the moulded phase. Third, run a bridging first-article inspection on the first moulded parts against the same drawing the printed parts were approved on, so that the transition is a documented delta rather than a surprise.
The most common bridge quality failure is not a defect at all. It is a change that was correctly notified for the printed process and silently carried into the tooled process, or the reverse, because the two control plans were maintained by different people. One control plan with a process column, reviewed at each gate, prevents it. The documentation expectations are the same ones covered in our PPAP guide, and where a customer requires a bridge on a casting rather than a moulding, the tooling logic is covered in vacuum casting versus printed bridge tooling.
The Failure Mode: Tooling Cut on Forecast
The single most expensive bridge error is ordering the tool when the forecast says the volume has arrived. It happens for understandable reasons: the tool lead time is long, the customer is pressing, and the tooling budget is easier to approve in the quarter it is requested than in the quarter it is needed.
The cost is easiest to see in the numbers. A USD 45,000 steel tool cut for a 20,000 unit forecast that delivers 8,000 has a per-part tooling cost of USD 5.63 instead of USD 2.25, which erases the entire saving the tool was justified by and leaves the programme worse off than if it had printed the whole 8,000. Add one engineering change at USD 15,000 and the tool has cost more than the printed route would have, on top of the lead time.
The mitigation is not to avoid tooling; it is to make the tool decision reversible. Aluminium bridge tooling is the standard answer at 2,000 to 10,000 units, because it costs a third of steel and produces a production-representative part. Where steel is unavoidable, the case for it should include the volume at which it loses money, stated explicitly, so the risk is visible before signature rather than after the year-end review. The same discipline applies to any tooling decision in a low-volume programme, including the printed nests and fixtures that support it, which is why the manufacturing tooling guide treats tool life and change cost as first-class numbers.
For programmes where the design is still moving at volume, printing may be the right answer for longer than the break-even suggests, because the cost of a design change in a tool is not in the tooling budget at all. It is in the weeks of lead time and the inventory that becomes scrap. A bridge agreement that allows a design revision per quarter at material cost is worth more than a two-dollar-per-part saving, and that comparison belongs in the business case next to the cost curves.
How to Write the Bridge Agreement
Four clauses convert a bridge from an intention into a plan, and each one is a number rather than a sentiment.
- Volume band and unit price. The printed price applies within a stated monthly band, with a defined mechanism for revisiting it outside the band.
- Tooling trigger. The cumulative confirmed volume at which the tool order is released, and who is responsible for the order.
- Design change allowance. How many engineering changes are absorbed at material cost, and the price of the next one.
- Exit obligation. The notice period on each side, the disposition of printed inventory at exit, and the validation required for the moulded first article.
With those four written down, the bridge has an exit and the programme has a decision schedule instead of a hope. That is the whole discipline, and it is the difference between using additive as a flexible production method and using it as an expensive way to postpone a conversation.

Volume Planning
Set the Trigger Before You Set the Tool
Precise3D quotes bridge production with a stated volume band, a tooling trigger and a design-change allowance, so the ramp decision is a number rather than a negotiation.