The Dashboard Nobody Opens
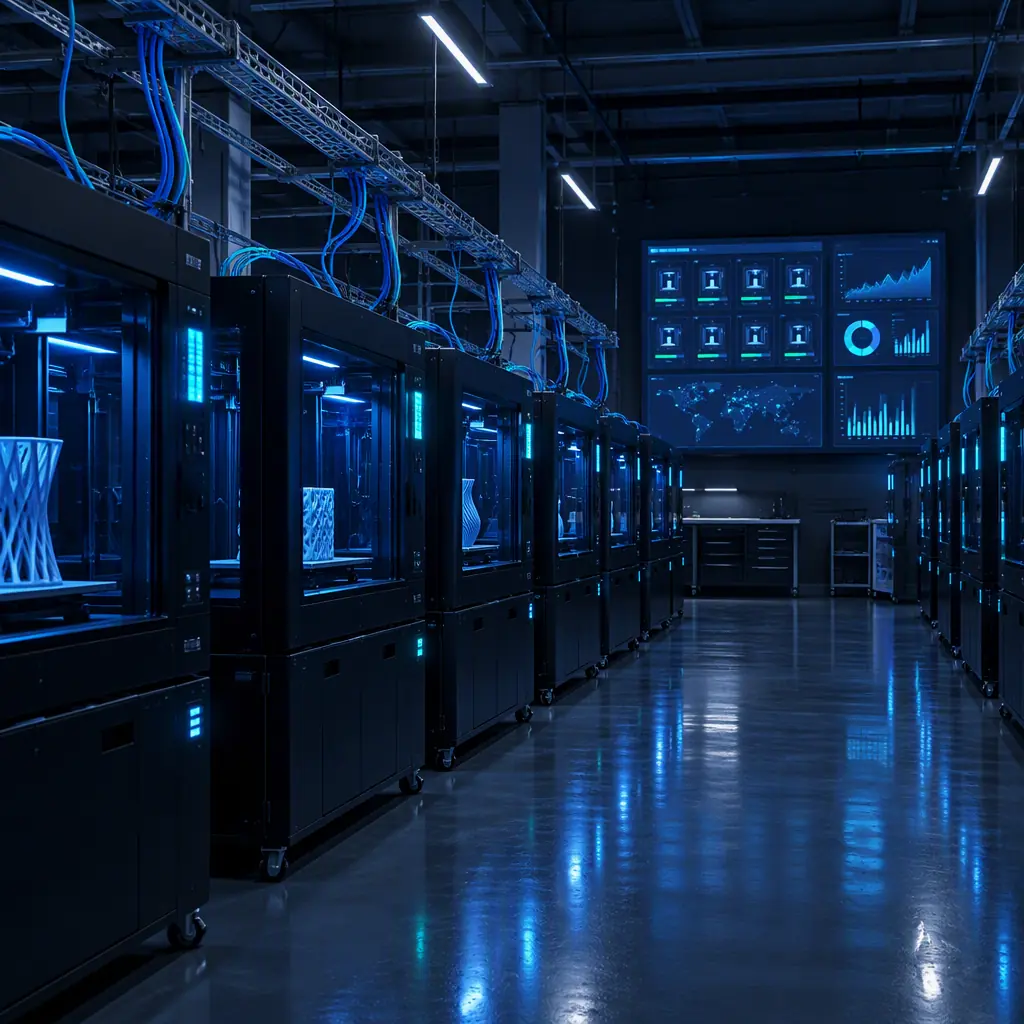
A contract manufacturer installed full telemetry on twenty-four machines: chamber temperature, hotend temperature, motor current, flow rate, vibration, power draw, and per-job timestamps. The monitoring platform produced eleven charts. Six months later the operations manager admitted he looked at one of them, and only when something had already gone wrong.
The installation was not a technology failure. Every sensor worked and every chart was accurate. The failure was that the data had never been tied to a decision anyone was making. Gathering a signal is a cost — sensor, wiring, licence, and above all the attention required to interpret it. A signal only becomes an asset when it is attached to an action that happens because of it.
The practical test for any candidate data point is a single question: what will we do differently based on this reading, and who will do it? If the honest answer is nothing, the instrumentation step can be deferred without loss.
The Signals That Change Decisions
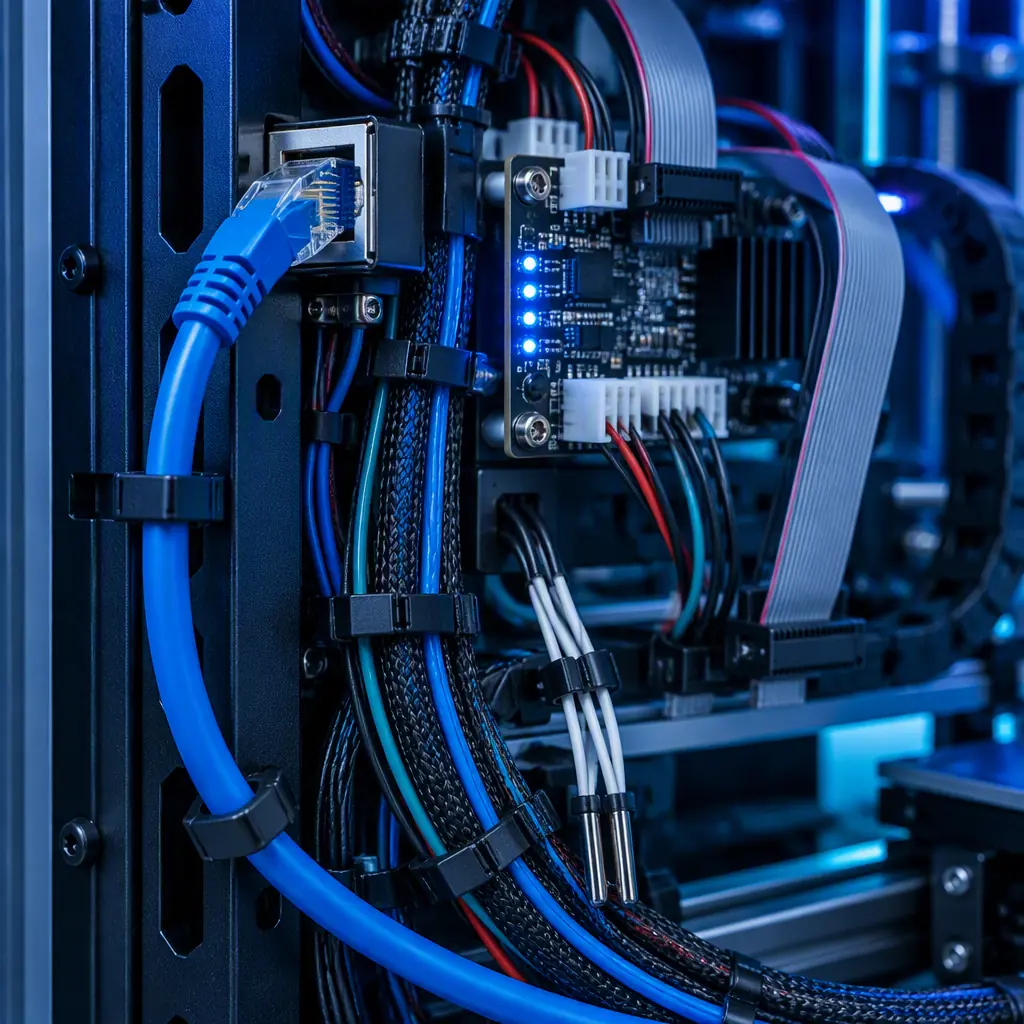
A useful subset of machine data maps directly onto the recurring decisions a print operation makes: whether to run a job, whether to service a machine, whether to trust a lot, and whether a process is drifting. Each of those decisions tolerates a different data cost, which is what determines the instrumentation order.
The table's ordering is deliberate. The two highest-value signals are also the cheapest, because they come from sensors the machine already has, and they answer the questions that recur daily. The expensive signals at the bottom tend to answer questions that recur rarely, which is why they are usually the wrong place to start.
What you're looking for: An answer that requires no work — a logged trace, a scrollable history — means the highest-value instrumentation is already in place and the floor can move on to dimensional data. An answer involving guesswork means the cheapest, highest-value signal on the list is being discarded.
Instrumentation Order for a Working Floor
Digitizing a print floor is a sequence, not a platform purchase. The order below starts at the cheapest decision-changing data and only advances when the previous step is actually being used.
- Step one: job and state logging. Every build records machine, material, spool, operator, start, end and outcome. This is a spreadsheet or an existing dashboard field set before it is a platform, and it makes failure rate per machine visible.
- Step two: thermal traces retained. Chamber and hotend history kept per job so a suspected thermal cause can be confirmed or ruled out rather than debated.
- Step three: coupon dimensions recorded. A recurring first-article coupon measured and logged per material and machine, which converts dimensional drift from an anecdote into a trend.
- Step four: material condition logged. Spool moisture at intake and dry-cycle history, which is the control that catches the failure mode that looks perfect on the outside.
- Step five: condition monitoring. Only after the first four are in use, add the sensor instrumentation that predicts mechanical wear, because that step costs the most and answers the rarest question.
Steps one through four typically run on data a machine already produces plus one moisture meter and one coupon measurement routine. That is the point worth making to any operation that believes digitization requires a capital project: the majority of the value sits in the free tier and only step five requires buying hardware.
What a Digital Twin Actually Is on a Print Floor
The term digital twin is often used to describe a 3D visualization of a machine. That is a model, not a twin. A twin is a live representation that stays in step with the physical asset closely enough to answer questions about it — and on a print floor, the questions that matter are about condition, history and remaining life.
In practice that means three linked records rather than a graphical model.
When those three records exist, questions that currently take a day of forensics become a query. Which machine has the highest failure rate on polycarbonate? Which hotend has run the most hours since replacement? Which machine drifted out of tolerance three weeks before the customer complained? Each of those is answerable from the history and condition records, and each of them drives a real action: recalibrate, replace, recalibrate the customer expectation.
The condition record is where the maintenance relationship becomes commercial. A machine with a documented service history and a measured drift trend can be serviced on evidence rather than on a calendar, which is the model set out in our maintenance plan guide, and the reliability metrics that make the trend interpretable are covered in our reliability MTBF and MTTR guide.
What you're looking for: A number answered from a record means the asset and history records exist and are in use. An answer that requires a walk to the machine display means the floor has sensors but no twin, which is the most common state and the cheapest one to fix.
Connecting the Data to Maintenance and Spares
The commercial payoff of digitization is that it turns maintenance from a cost centre into a planned activity, and it turns spares stocking from a hunch into a forecast. Both require the same condition record, used in two ways.
- Scheduled replacement from measured hours. Nozzles, hotends, belts and build plates replaced at intervals derived from actual operating hours and observed wear, not from a generic recommendation.
- Spares levels from failure history. Consumables stocked against the observed failure distribution across the fleet, which is what keeps a spares kit proportionate instead of either empty or overstocked — the design method for that kit is covered in our critical spares kit guide.
- Uptime measured rather than assumed. Actual availability calculated from job and failure logs, which is the only honest input to a service-level commitment to a customer.
The uptime point links directly back to capacity. A floor whose measured availability is 82% has a very different real capacity from one whose nameplate suggests 95%, and the difference shows up as the constraint described in our line balancing guide. Digitization does not add capacity, but it is the only reliable way to know how much capacity actually exists.
Keeping the Data Trustworthy
Instrumentation that is not maintained becomes actively misleading, which is worse than having none. Three disciplines keep a digitized floor honest.
- Log at the point of work. If job outcome or service event entry is a separate task done later from memory, the record will drift from reality within weeks.
- Calibrate the sensors that feed decisions. A thermistor that reads 4°C low turns every thermal trace into a false record, and the replacement-and-drift behaviour of those sensors is covered in our thermocouple and RTD drift guide.
- Delete signals that change nothing. Every maintained but unused channel is a recurring cost and a source of noise that makes the useful channels harder to read.
The third discipline is the one that most digitization projects skip and most need. A floor with three trusted signals that drive three actions is in a better position than one with forty channels and no agreed response to any of them, because the three-signal floor can explain why it changed what it changed.
Where the data also touches machine control itself — networked printers, remote access, job files moving between systems — the security dimension becomes part of the same project rather than a separate one, and the exposure created by connecting production equipment to a network is set out in our 3D printer cybersecurity guide. The cloud connectivity features that make remote monitoring possible are covered in our remote monitoring guide.
Precise3D on Instrumented Machines
At Precise3D, the digitization conversation starts with which decisions a customer needs to make, because instrumentation that does not answer a question is a running cost with no return. Our Pro X1 and OpenSource1 platforms expose the thermal and flow data that the first four instrumentation steps depend on, with chamber and hotend sensing designed to remain stable across long unattended runs so that the trace a customer logs is a record of the process rather than of sensor drift.
Every unit ships with CE LVD (EN 62368-1:2014+A11:2017) and RoHS (EU 2015/863) documentation, and our 3,500 sqm Shenzhen production network applies a documented control plan at incoming and outgoing QC — the same instrumented-record discipline we recommend customers apply to their own floors. For distributors, we supply sensor mappings, spares lists and maintenance intervals in a form that plugs directly into the asset and condition records described here.
Reviewed by the Precise3D engineering team. Instrumentation sequences, data cost estimates and availability figures described here are illustrative guidance and are not a guarantee of performance for any particular operation. Assess your own decision requirements and security exposure before connecting production equipment to a network.
Digitizing a Print Floor?
Want the Machine Data Checklist and Sensor Map?
Tell us how many machines you run and what you are trying to decide. We will send the data checklist ordered by decision value, plus the sensor and spares map for the platforms you operate so your asset records start from accurate documentation.