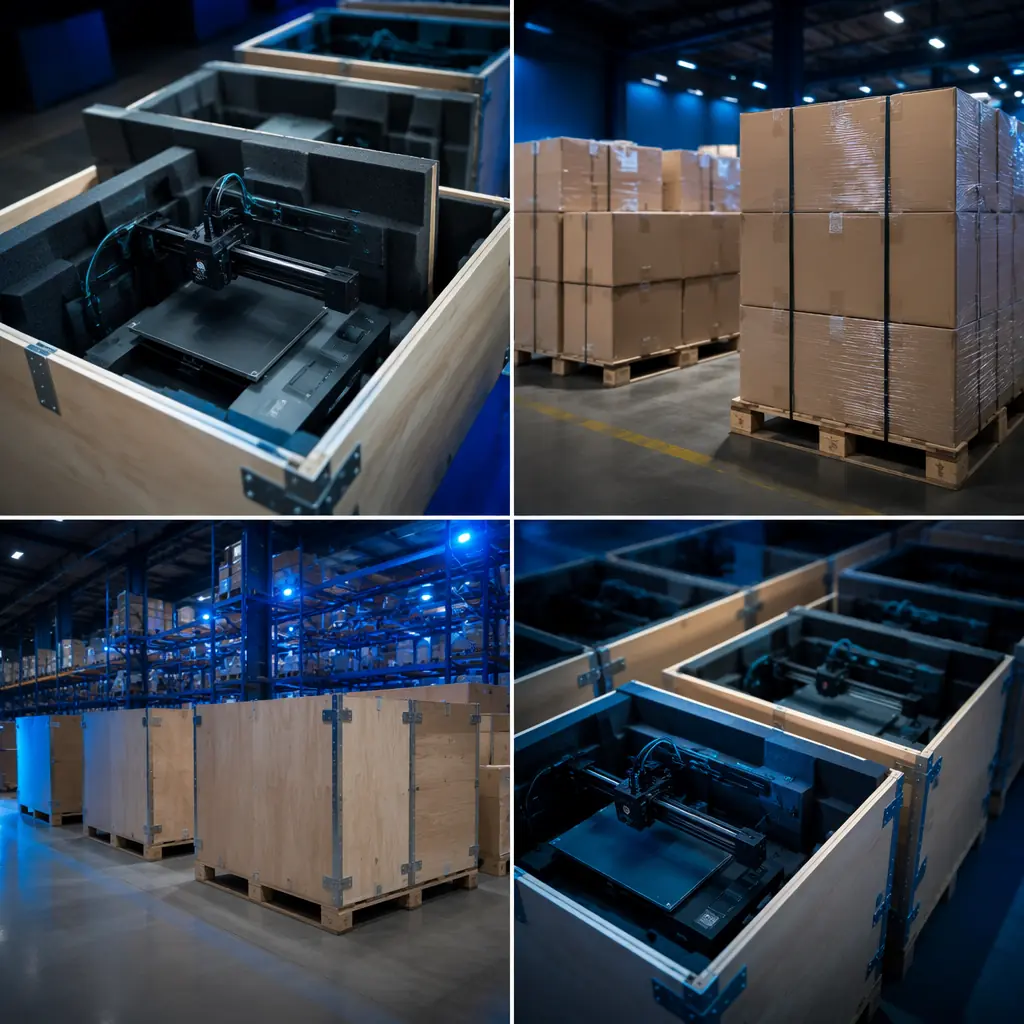
3D printer distribution is a supply chain business disguised as a technology business. The product differentiation, TMC drivers, linear rails, enclosure temperature control, matters only if the product is physically present in your warehouse when the customer's purchase order arrives. Every distributor who has been in the business for more than two years has a stockout story: the best-selling model that went out of stock in October, the replacement order that got bumped to December because the factory was prioritizing a larger customer, the container that arrived in January. And the 40% of Q4 revenue that evaporated because B2B buyers who needed printers in November bought from a competitor who had inventory. This guide is about the systems that prevent that story from happening twice. It's built on supply chain data from Precise3D's network of 200+ distributors and the lead time patterns we've observed across 15+ factory production cycles since 2023.
The Real Cost of a Stockout
Most distributors think of a stockout in terms of the immediate lost sale: one printer out of stock = one lost sale. The actual cost is 3–5x that number, and it plays out over months, not days. Here is the chain reaction, based on aggregated data from Precise3D distributor partners who shared their inventory records for this analysis.
Week 1-2: Lost immediate sale (1 unit). Customer buys from competitor.
Week 3-4: Lost repeat purchase. The B2B customer who bought the competitor's printer now buys filament, spare parts, and their second unit from the competitor, because they're already in that supplier's system.
Month 2: Lost referral. The university lab manager who bought from the competitor recommends them to a colleague at another university. That recommendation would have been yours.
Month 3: Competitor locks in a volume contract. The B2B buyer who switched during the stockout signs a 12-month agreement with the competitor because switching suppliers again is administratively painful.
Month 6: The revenue hole from a 4-week stockout on one SKU stabilizes at 3.2x the unit's retail price, averaged across Precise3D's distributor network, accounting for lost repeat filament sales, lost spare parts revenue, and lost contract opportunities.
For a distributor moving 50 units per month with an average unit price of $499, a single 4-week stockout on the best-selling model (typically 20–25% of volume, or 10–12 units) produces a direct revenue loss of $5,000–6,000 in the first month and a total cascade loss of $16,000–19,000 over six months. For a distributor moving 200+ units per month, the threshold where dedicated inventory management becomes non-negotiable, those numbers scale linearly. Our inventory management guide covers the daily operational side, reorder points, ABC analysis, seasonal demand forecasting. This guide covers the strategic layer: what happens when the reorder point formula says "order now" but the factory says "lead time is 12 weeks."
Factory Lead Times: The Numbers Behind the Promise
When a Chinese 3D printer factory quotes a 30-day lead time, the number means "30 days from order confirmation to ex-factory date, assuming the production slot is available, the components are in stock, and no larger customer bumps your order." Here is what the actual lead time looks like, broken into its real components, based on data from Precise3D's own production scheduling and confirmed by distributor partners who shared their supplier timelines.
The takeaway: a "30-day lead time" from a Chinese factory is actually 52 days door-to-door in the optimistic case and 80+ days with one or two routine delays. Building your inventory model around the quoted number is the single most common supply chain mistake in 3D printer distribution, and the one with the most expensive consequences. For the complete logistics picture including HS codes, tariffs, and customs broker selection, see our shipping & logistics guide and our import tariffs & HS codes guide.
Safety Stock That Actually Works
The textbook safety stock formula, z-score × standard deviation of demand × √lead time, is mathematically correct and practically useless for 3D printer distribution. The reason: lead time variability is the dominant term, and √lead time underweights it. A factory lead time that varies between 52 and 95 days has a standard deviation of roughly 15 days. By the textbook formula, safety stock for a 95% service level (z=1.65) with monthly demand of 20 units and 2-month lead time would be: 1.65 × 5 × √2 = 11.7 units. This formula assumes demand is the primary source of uncertainty. It is not. The lead time is.
Here is a modified formula that accounts for the reality of Chinese manufacturing supply chains, validated against Precise3D distributor restocking data:
Safety Stock = (Average Daily Demand × Maximum Observed Lead Time) − (Average Daily Demand × Average Lead Time) + Demand Buffer
Where:
• Average Daily Demand = monthly unit sales ÷ 30
• Maximum Observed Lead Time = longest door-to-door time in the last 12 months (not the factory's quoted number)
• Average Lead Time = mean door-to-door time over the same 12 months
• Demand Buffer = 2 weeks of average daily demand (covers demand spikes during stockout vulnerability window)
Example: 20 units/month, 95-day max lead time, 60-day average lead time, 2-week demand buffer
= (0.67 × 95) − (0.67 × 60) + (0.67 × 14)
= 63.7 − 40.2 + 9.4 = 33 units safety stock
Compare to textbook: 12 units. The textbook formula would leave you out of stock for 5-7 weeks on a bad lead time draw. The corrected formula keeps you in stock through the worst-case scenario your supply chain has actually demonstrated.
Multi-Sourcing: One Supplier Is a Single Point of Failure
The instinct of a growing distributor is to consolidate suppliers. More volume with one factory means better pricing, simpler logistics, one relationship to manage. The math of consolidation is correct until the day the factory has a problem. Then the math of consolidation means 100% of your revenue is exposed to one factory's production schedule.
The 80/20 multi-sourcing model:
Place 80% of volume with your primary supplier (best pricing, deepest relationship) and 20% with a qualified secondary supplier. The secondary supplier serves three functions: (1) surge capacity, when your primary is 4 weeks behind schedule, you can pull forward the secondary's next order; (2) negotiation leverage, the primary supplier knows you have alternatives, which changes the conversation when they try to bump your production slot for a larger customer; (3) insurance, if the primary supplier has a catastrophic problem (factory fire, export license issue, quality crisis requiring a production halt), you have an operational supply chain while you find a new primary.
The qualification bar for secondary suppliers:
A secondary supplier does not need to match your primary on price, 5-10% higher unit cost is the insurance premium. They do need to match on: (a) certification equivalence (CE, FCC, RoHS, if your primary's products are certified for your market, the secondary's must be too); (b) component transparency (you need to know which stepper drivers, PSU, and motherboard they're using, a secondary that can't tell you the TMC chip model is not a real supplier); (c) minimum order quantity that your cash flow can support (typically 20-50 units for a secondary relationship). For the full certification verification framework, see our certification & compliance guide.
Precise3D's multi-sourcing architecture:
We maintain production capacity across two factory campuses in Shenzhen, the main campus (8 assembly lines) for high-volume models and a secondary campus (3 lines) for specialty SKUs and surge capacity. Both campuses share the same component supply chain, quality management system, and ERP integration, so a distributor ordering from Precise3D is effectively multi-sourced by default. The secondary campus can absorb production overflow within 48 hours of a schedule change. This architecture is one of the reasons Precise3D has maintained on-time delivery rates above 94% across all distributor orders since Q1 2025. For a deeper look at how factory operations affect your supply reliability, see our factory audit & QC checklist and our MOQ & payment terms guide.
Demand Forecasting: Separating Signal from Noise
The classic mistake in distributor demand forecasting is extrapolating from too little data. A distributor who sold 30 units in October, 45 in November, and 60 in December concludes they have 50% month-over-month growth and orders 90 units for January. January delivers 35 units, back to the baseline, and they now have 55 units of excess inventory tying up working capital for 3-4 months. The November-December spike was Q4 seasonality (holiday consumer demand, B2B budget flush), not a trend.
Seasonal pattern for consumer 3D printers:
Based on aggregated data from Precise3D's distributor network across 30+ countries, the seasonal demand pattern is: Q1 (Jan-Mar): 85% of baseline (post-holiday slowdown); Q2 (Apr-Jun): 95% (spring maker season, education purchases); Q3 (Jul-Sep): 105% (back-to-school, pre-holiday B2B budget planning); Q4 (Oct-Dec): 140% (holiday consumer demand + B2B year-end budget flush). The Q4 spike is 35-45% above baseline, not 50%+. The dramatic outliers are individual distributor stories, not the network average. For distributors in education-heavy markets, our education market guide covers the specific procurement calendar for universities and K-12 schools, which has its own seasonal pattern (May-July budget allocation, August-September purchasing).
Cash Flow Implications of Supply Chain Decisions
Inventory is frozen cash. A container of 100 printers at $250 FOB per unit is $25,000 of working capital sitting on a ship for 4-6 weeks, then in your warehouse until the units sell. The cash flow math isn't complicated but it's rarely modeled explicitly. If your gross margin is 35% and your inventory turnover is 4x per year (90 days from receiving to selling), each dollar tied up in inventory generates $0.35 × 4 = $1.40 in annual gross profit. If you increase turnover to 6x (60 days) by ordering smaller batches more frequently, and accept a 5% higher unit cost from the factory for smaller order quantities: each dollar generates $0.30 × 6 = $1.80. The lower unit margin produces higher annual return on inventory investment because the money cycles faster.
This is why the "buy more to get better pricing" instinct can be mathematically wrong for distributors under $2M annual revenue. The 5-8% unit cost savings from a larger order is consumed by the cost of carrying that inventory for an extra 30-60 days: warehouse space, insurance, obsolescence risk (a new model announcement from a competitor can devalue your existing stock overnight), and the opportunity cost of the working capital itself. At a 12% cost of capital, a reasonable figure for a small distribution business, holding $25,000 in extra inventory for 60 days costs $493 in direct financing costs, plus warehouse overhead. The unit cost savings on a 100-unit order at 5% discount is $1,250. Net benefit: $1,250 − $493 − $300 (warehouse) = $457. Positive but thin, and it turns negative if the larger order pushes your inventory turnover below 3x. For the complete financial modeling framework including margin, turnover, and working capital optimization, see our distributor cash flow management guide.
Building a Supply Chain Early Warning System
The difference between a stockout that costs you a week of sales and one that costs you a quarter is how early you detect the problem. Here is a practical early warning system that Precise3D distributors have built around their supply relationships, organized by lead time before impact.
None of these signals require sophisticated software. They require a weekly 10-minute check: (1) email the factory for a production status update, (2) check your inventory levels against the corrected safety stock formula, (3) verify the shipping schedule for any in-transit containers. The cost of this routine is 40 minutes per month. The cost of not doing it is the stockout cascade described at the top of this guide. For the full operational playbook on daily inventory management, see our inventory management guide.
Bottom Line
Supply chain resilience in 3D printer distribution is not about predicting disruptions, it's about building systems that absorb them. A distributor who plans for the factory's quoted 30-day lead time will be out of stock at least once per year. A distributor who plans for the actual 52-95 day window, maintains 33 units of corrected safety stock on their best-selling SKU, has a qualified secondary supplier receiving 20% of volume, and checks three signals every Monday morning will be the distributor whose customers never learn their competitor's phone number.
At Precise3D, we've built our production architecture around the same principles we recommend to distributors: dual-campus manufacturing capacity, shared component supply chains, real-time production visibility through weekly distributor updates, and on-time delivery rates above 94% sustained across two years of operations. Because the best supply chain strategy is one your customers never need to think about. They place the order, the inventory is there, and the only thing they notice about your supply chain is that it never fails.
Reviewed by the Precise3D engineering & OEM team. Compliance files that accompany the catalog are auditable at the certification register.
Start Your Partnership
Ready to Bring supply chain resilience to Your Market?
Distributors selling supply chain resilience build margins with OEM & white-label hardware - request the program sheet and volume pricing.